Predictive Rent Growth: What Your Assumption Is Actually Worth
Discover the true value of your assumptions with predictive rent growth insights. Don't miss out on maximizing your investment potential. Learn more now!
Every hold-period projection contains an assumption nobody can verify in advance: how quickly rent will rise.
Predictive rent growth is the process of building that assumption from observable market and property conditions rather than carrying forward a convenient percentage simply because it makes the model work.
The impact can be substantial. Over a five-year hold, changing the rent-growth assumption by a single percentage point can materially alter projected NOI and exit value. That makes rent growth one of the inputs worth stress-testing most carefully, particularly when a large share of the projected return arrives at sale.
What Predictive Rent Growth Means
Predictive rent growth is a forward estimate of how rental rates may change for a specific property within a specific submarket.
It sits inside the broader process of rental income forecasting: projecting what a property may collect over the hold rather than simply annualizing today's rent.
The first distinction to make is between market-level rent growth and property-level rent opportunity.
A metro-level forecast might combine:
newly delivered luxury apartments
older workforce housing
downtown high-rises
suburban garden apartments
different unit sizes
rental demand
neighborhoods with very different supply pipelines
Those properties do not necessarily experience rent changes at the same pace.
A market forecast (Zillow Research among the main publishers) can therefore provide useful context without being an appropriate property-level assumption on its own.
A better underwriting process works in two layers:
estimate what the property's submarket may support over time
determine how the specific property's current rents, lease expirations, condition, and competitive position affect what can actually be captured
The second layer is where much of the actionable underwriting work happens.
The One-Point Difference That Decides Your Exit
Consider a hypothetical stabilized property generating $200,000 of effective annual revenue and $80,000 of operating expenses, producing:
$120,000 of NOI
At a 6% cap rate, the implied purchase price is:
$120,000 ÷ 0.06 = $2,000,000
These figures are illustrative teaching assumptions rather than current market data.
Hold the property for five years and assume the exit cap rate remains at 6%.
Now change only the growth assumptions.
Scenario | Year-6 NOI | Exit Value at 6% Cap | Change vs. $2,000,000 |
|---|---|---|---|
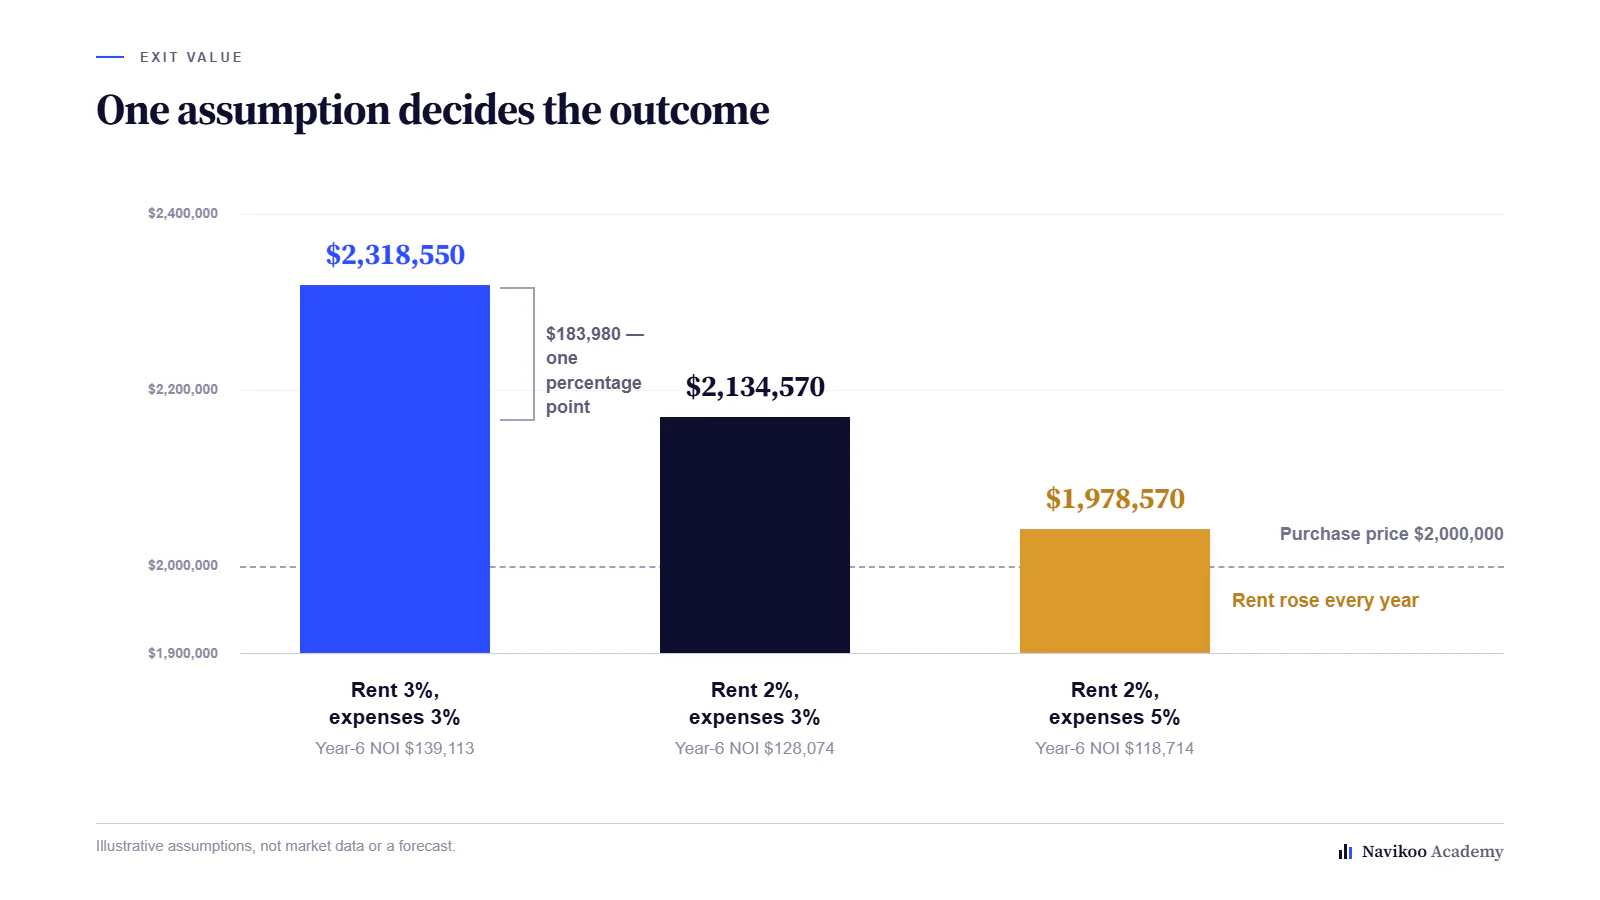
Rent +3%, expenses +3% annually | $139,113 | $2,318,550 | +$318,550 |
Rent +2%, expenses +3% annually | $128,074 | $2,134,570 | +$134,570 |
Rent +2%, expenses +5% annually | $118,714 | $1,978,570 | −$21,430 |
The first two scenarios differ by only one percentage point of annual rent growth, yet the projected exit values differ by roughly $184,000.
The reason is straightforward. Revenue growth affects NOI after the property's expense structure is accounted for, and the resulting NOI is then capitalized into the projected exit value.
The third scenario adds another useful lesson.
Rent increases every year, but operating expenses increase faster. By Year 6, NOI falls below the starting level and the projected value at the same cap rate is slightly below the original $2 million price.
A model that forecasts rents carefully while giving little attention to insurance, property taxes, utilities, maintenance, property management or payroll can therefore produce a misleading result even when the rent assumption itself looks reasonable.
Rent growth and expense escalation should be modeled separately.
Where Growth Actually Comes From
Future rental revenue can increase for two very different reasons.
One is market rent growth: comparable units across the submarket become more expensive because supply and demand conditions change.
The other is mark-to-market opportunity: the property is already charging less than similar units command today.
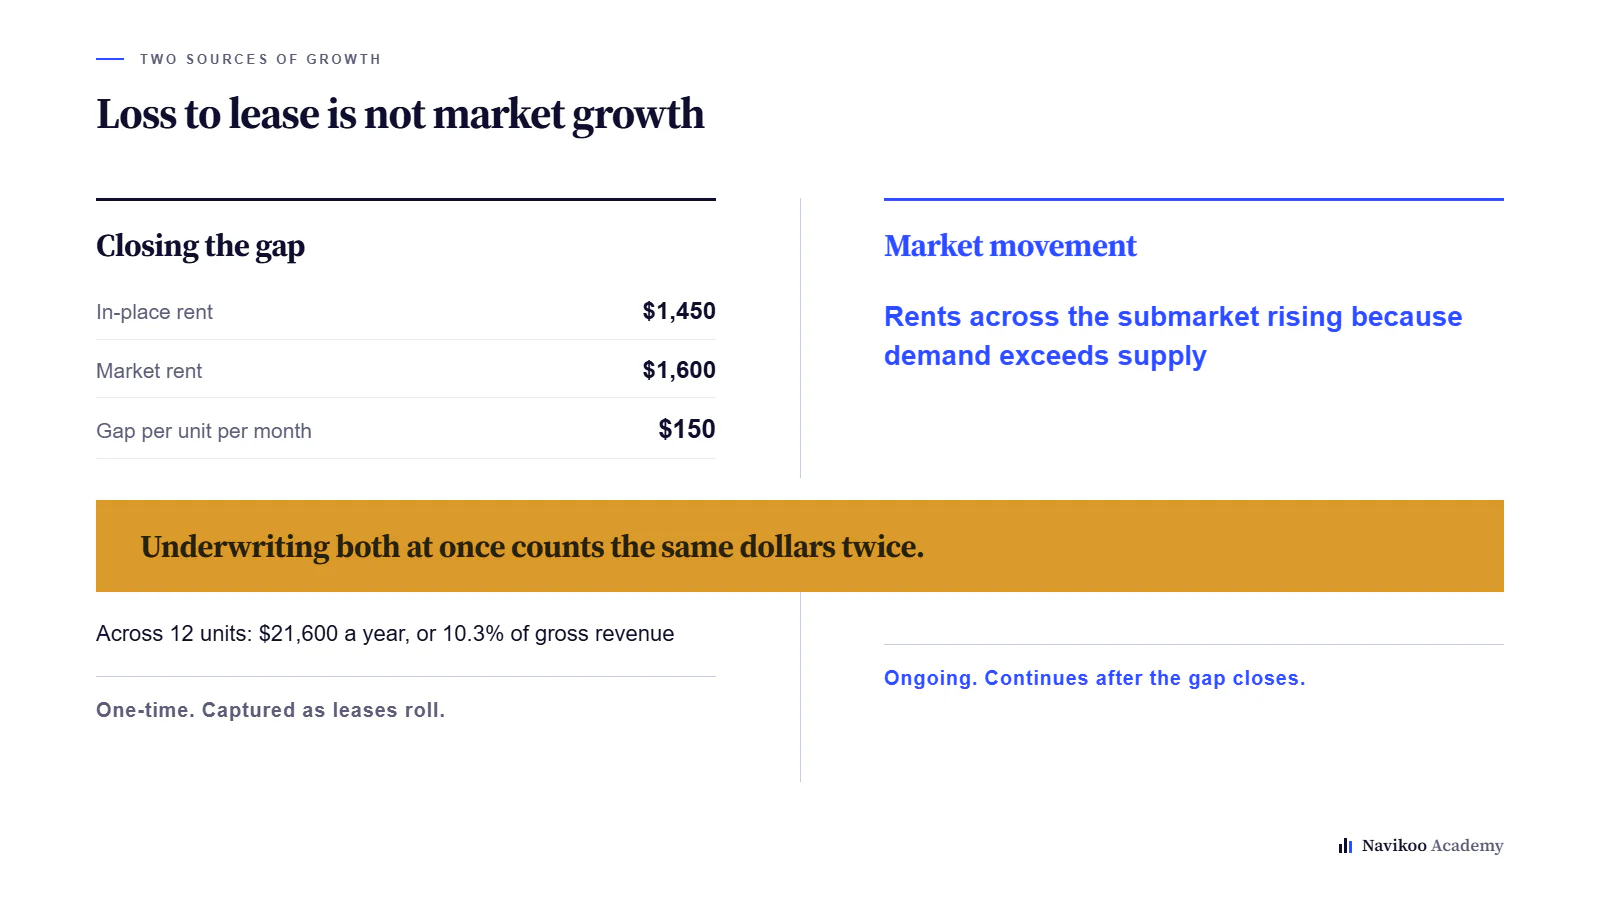
Consider a hypothetical 12-unit property currently renting at $1,450 per unit while comparable units support approximately $1,600.
The gap is:
$150 per month per unit
Across 12 apartments:
$150 × 12 × 12 = $21,600 of annual potential revenue
Current scheduled annual rent is:
$1,450 × 12 × 12 = $208,800
So the existing rent gap equals roughly 10.3% of current scheduled revenue.
That 10.3% is not a forecast of future market growth.
It is an existing pricing gap that may be captured as leases renew, assuming the units genuinely support the higher rent.
That distinction matters because double-counting is easy.
Suppose an investor assumes 3% annual market growth while also planning to move existing $1,450 rents immediately toward today's $1,600 market level.
Those are two separate revenue drivers and should appear separately in the model.
A cleaner approach is to:
identify current in-place rents
verify realistic market rents using comparable properties
map lease expiration dates
model mark-to-market increases as leases renew
apply future market growth only after the existing gap has been addressed
This creates a more transparent forecast and makes it much easier to see where projected revenue actually comes from.
What Actually Predicts It
No single variable reliably predicts future rent growth on its own. A useful forecast combines several forward-looking signals and checks whether they tell a consistent story.
Three deserve particular attention.
New construction and scheduled deliveries.
Housing permits, projects under construction, and planned deliveries show how much competing supply may enter the submarket. A large wave of new apartments can increase competition for tenants and contribute to slower rent growth, higher concessions, or longer lease-up periods.
Supply already under construction is particularly useful because it is more observable than broad predictions about future demand.
Local income and employment conditions.
Tenants ultimately pay rent from household income. Wage growth, employment trends, major employer expansions or contractions, and changes in the local labor market all affect how much rental growth a market may be able to absorb.
Strong income growth does not guarantee rent growth, but projecting large increases in rent without considering tenant purchasing power creates an incomplete forecast.
Occupancy, absorption, and concessions.
Occupancy rates indicate how full comparable properties are. Absorption shows whether newly delivered units are actually being leased. Concessions can reveal weakening conditions before headline asking rents decline.
A local property manager or leasing professional can add useful context here because they may see renewal behavior, tenant resistance, concessions, and leasing velocity at a level that metro-wide datasets do not capture.
Technology and AI-based forecasting tools can help identify patterns across listing, lease, and market data. Their outputs are most useful when treated as another input rather than a substitute for understanding the underlying supply-and-demand conditions.
Recent rent growth deserves caution as well.
A market that produced strong increases over the previous several years will not necessarily continue at the same pace. New supply, affordability pressure, employment changes, and economic conditions can shift while historical trend lines still look strong.
Forecasting should explain why future growth is plausible, not simply extend what already happened.
The Ceiling Most Projections Ignore
Affordability provides a useful reality check for aggressive rent-growth assumptions.
One commonly referenced housing-cost guideline uses approximately 30% of gross household income as a benchmark.
Consider a household earning $75,000 per year.
Thirty percent of gross income equals:
$75,000 × 30% = $22,500 per year
or:
$1,875 per month
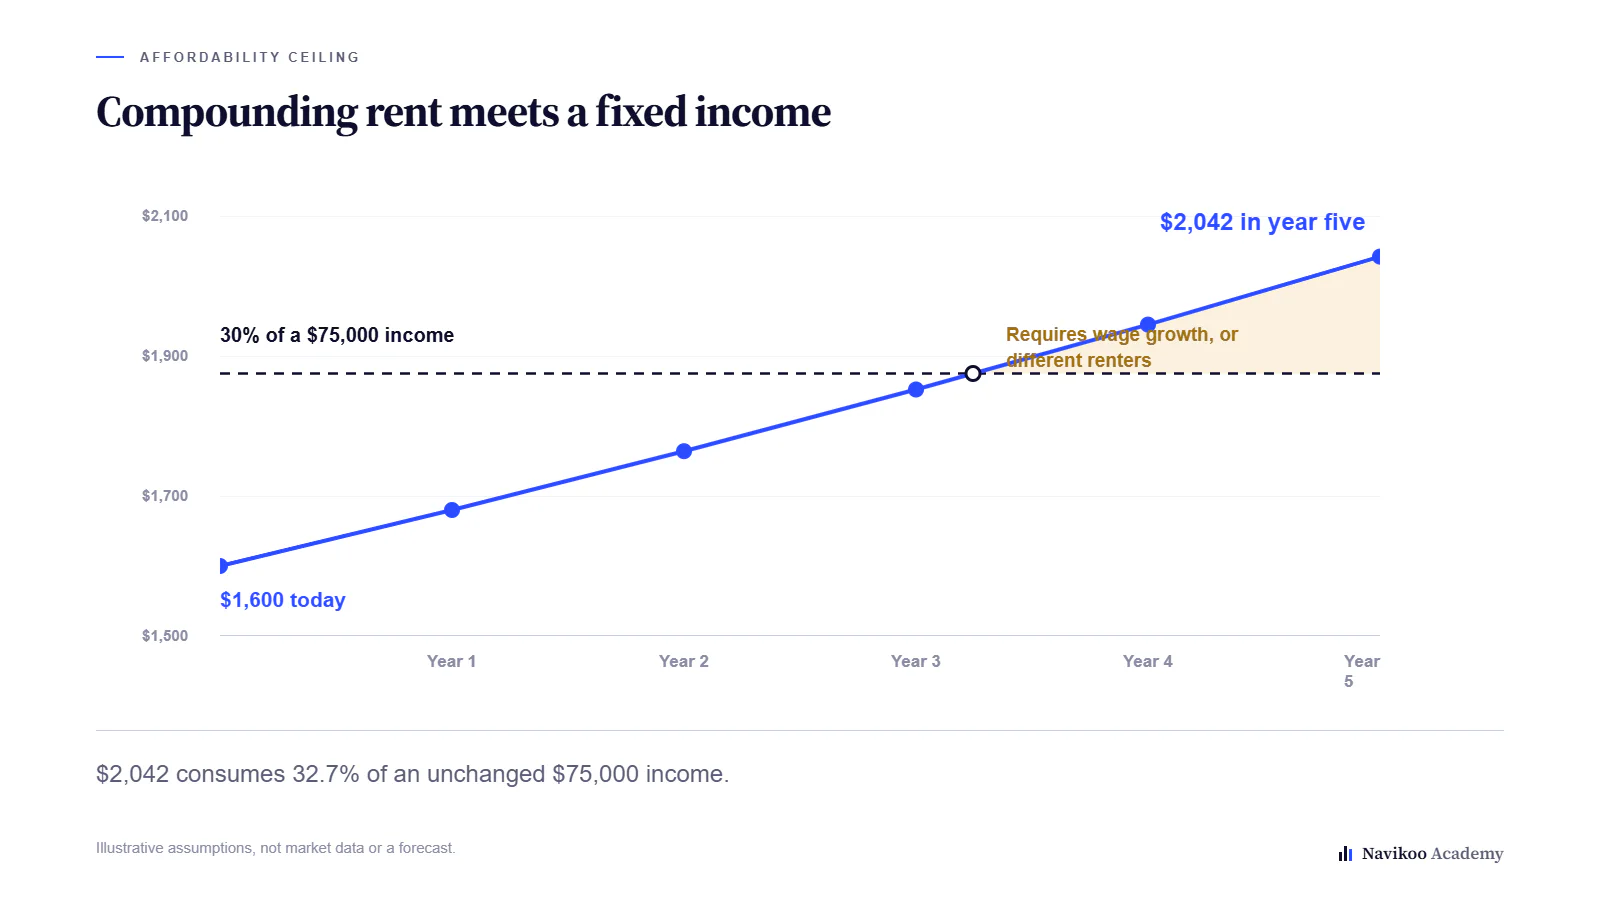
Suppose comparable market rent is currently $1,600.
At that level, the rent represents:
$1,600 × 12 ÷ $75,000 = 25.6% of gross income
There appears to be some room between current rent and the simplified affordability benchmark.
Now grow the $1,600 rent by 5% annually for five years:
$1,600 × 1.05⁵ ≈ $2,042
If household income remained unchanged, that rent would represent approximately:
$2,042 × 12 ÷ $75,000 ≈ 32.7%
The forecast has now crossed the original affordability guideline.
That does not prove the rent is impossible.
It means the projection now contains another assumption: local household incomes must increase, the tenant mix must shift toward higher earners, households must devote more income to housing, or some combination of those outcomes must occur.
This is a useful way to interrogate a forecast.
A rent-growth assumption eventually becomes an assumption about the people who will have to pay that rent.
Retention matters here as well. A large rent increase that causes a good tenant to leave can introduce vacancy, leasing expenses, cleaning, repairs, and turnover costs. A smaller renewal increase may sometimes produce a better economic result than maximizing the new asking rent.
Rules of Thumb That Travel Badly
Rules of thumb can be useful for screening, but they become misleading when they are treated as forecasts.
The 2% rule says monthly rent should equal roughly 2% of purchase price.
Applied to the hypothetical $2,000,000 property, it would require:
$40,000 of monthly rent
That is equivalent to:
24% annual gross rent relative to purchase price
The more commonly discussed 1% rule implies a 12% annual gross rent-to-price relationship.
These rules have little to do with predicting future rent growth. They are quick acquisition screens comparing today's rent with today's purchase price.
A 2% rent-to-price ratio is difficult to find in many current U.S. markets and should not be treated as a universal acquisition standard.
Dollar-based growth assumptions create a different problem.
Suppose someone says:
“Rent should increase $100 per year.”
At a current rent of $1,450, a $100 monthly increase equals:
$100 ÷ $1,450 = 6.9%
At $2,500 rent, the same $100 increase equals:
4.0%
The dollar amount looks identical while the economic assumption is very different.
Percentage-based assumptions make comparisons across properties easier, but even percentages need to be tested against:
competing rents
tenant incomes
expected supply
lease expiration schedules
turnover costs
property condition
The percentage is only the starting language of the forecast.
What the 2027 Market Outlook Is Worth
Published forecasts for the year ahead are genuinely useful as a starting frame and genuinely dangerous as an underwriting input, and the distinction rests on what they actually measure.
Published forecasts of this kind are weighted averages of submarkets that are diverging. It is built from data carrying a reporting lag, it embeds assumptions about interest rates and construction delivery that may not hold, and interest rates alone can reprice an entire industry within a quarter, and it says nothing about the specific building under consideration. Real estate investors wanting current commentary on real estate rents can find informed discussion of these forecasts on shows such as BiggerPockets' On the Market Podcast (Click here to listen on Apple Podcasts), a reasonable way to track how the industry is reading market conditions.
The practical handling of any published figure: treat it as the centre of a range rather than a point, underwrite at the low end, and check whether the submarket has supply or earnings dynamics that would pull it away from the average. Used that way, external recommendations improve informed decisions. Pasted into a spreadsheet as a fixed input, they mostly manufacture confidence.
Building an Assumption You Can Defend
Start with the property itself.
Document current in-place rents and compare them with realistic competing rents for similar units. You can verify comparable rents and rental market using Navikoo’s Rent Estimate tool.
The goal is to understand whether the building is already near market or whether some of the projected revenue growth actually comes from correcting below-market leases.
Then map lease expiration dates.
A property with every lease renewing in the next six months presents a very different opportunity from one where below-market tenants are locked into longer agreements. Timing matters even when the final rent target is identical.
Next, build the market layer.
Review:
units currently under construction
scheduled apartment deliveries
vacancy and occupancy
leasing concessions
recent absorption
local employment trends
household income trends
comparable renewal and asking rents
rental market predictions
Where the signals conflict, document the conflict rather than forcing them into a precise forecast.
For example, strong employment may support demand while a large wave of apartment deliveries limits near-term pricing power. The appropriate assumption may be modest growth in the first two years followed by stronger growth after the new supply is absorbed, rather than one fixed percentage applied mechanically across the entire hold.
Operating expenses deserve their own forecast.
Insurance, property taxes, utilities, payroll, repairs, and other expenses do not necessarily move at the same rate as rent. Running separate assumptions makes it possible to see whether revenue growth actually becomes NOI growth.
Finally, stress-test the rent assumption.
If the base case uses 3%, rerun the model at 2%.
If the deal becomes unattractive after a one-percentage-point reduction, the underwriting is telling you something important: a meaningful portion of the expected return depends on a forecast that cannot be guaranteed.
A stronger model shows:
in-place rent
current market rent
mark-to-market opportunity
renewal timing
future market-growth assumptions
expense escalation
downside scenarios
That makes the forecast easier to review and challenge later.
Investors who want to test rent growth, vacancy, operating expenses, financing, and exit assumptions together can model those variables in Navikoo's analysis tools rather than changing one input in isolation.
No rent-growth forecast becomes certain simply because it sits inside a spreadsheet. The objective is to make the assumptions visible enough that another investor could understand where they came from, challenge them, and reproduce the analysis.