What Is Cash on Cash Return in Real Estate?
Cash on cash return measures what an investor's actual out-of-pocket money earns in cash over a year. The formula is annual pre-tax cash flow divided by total cash invested.
Two investors buy the same triplex on the same street for the same price. One pays cash. One finances 75% of it. At the end of year one their properties performed identically, and their returns were nowhere close.
That gap is what cash on cash return captures. It answers a narrow, useful question: of the money actually taken out of pocket to acquire a property, how much came back as cash in a year? For most real estate investors it is the first figure run on a rental deal and the one quoted most often in conversation.
Cash on Cash Return = Annual Pre-Tax Cash Flow ÷ Total Cash Invested
A cap rate describes a building. This metric describes an investor's position in that building. Change the down payment, the loan terms, or the closing costs, and the cash return moves even though the property never changed at all.
What follows is the formula in detail, a worked example with real numbers, how leverage reshapes the result, and the specific places where a cash return misleads investors who lean on it too hard.
What Is Meant by Cash on Cash?
The phrase is literal. Cash out of pocket on one side, cash received on the other, both measured across a single year of ownership.
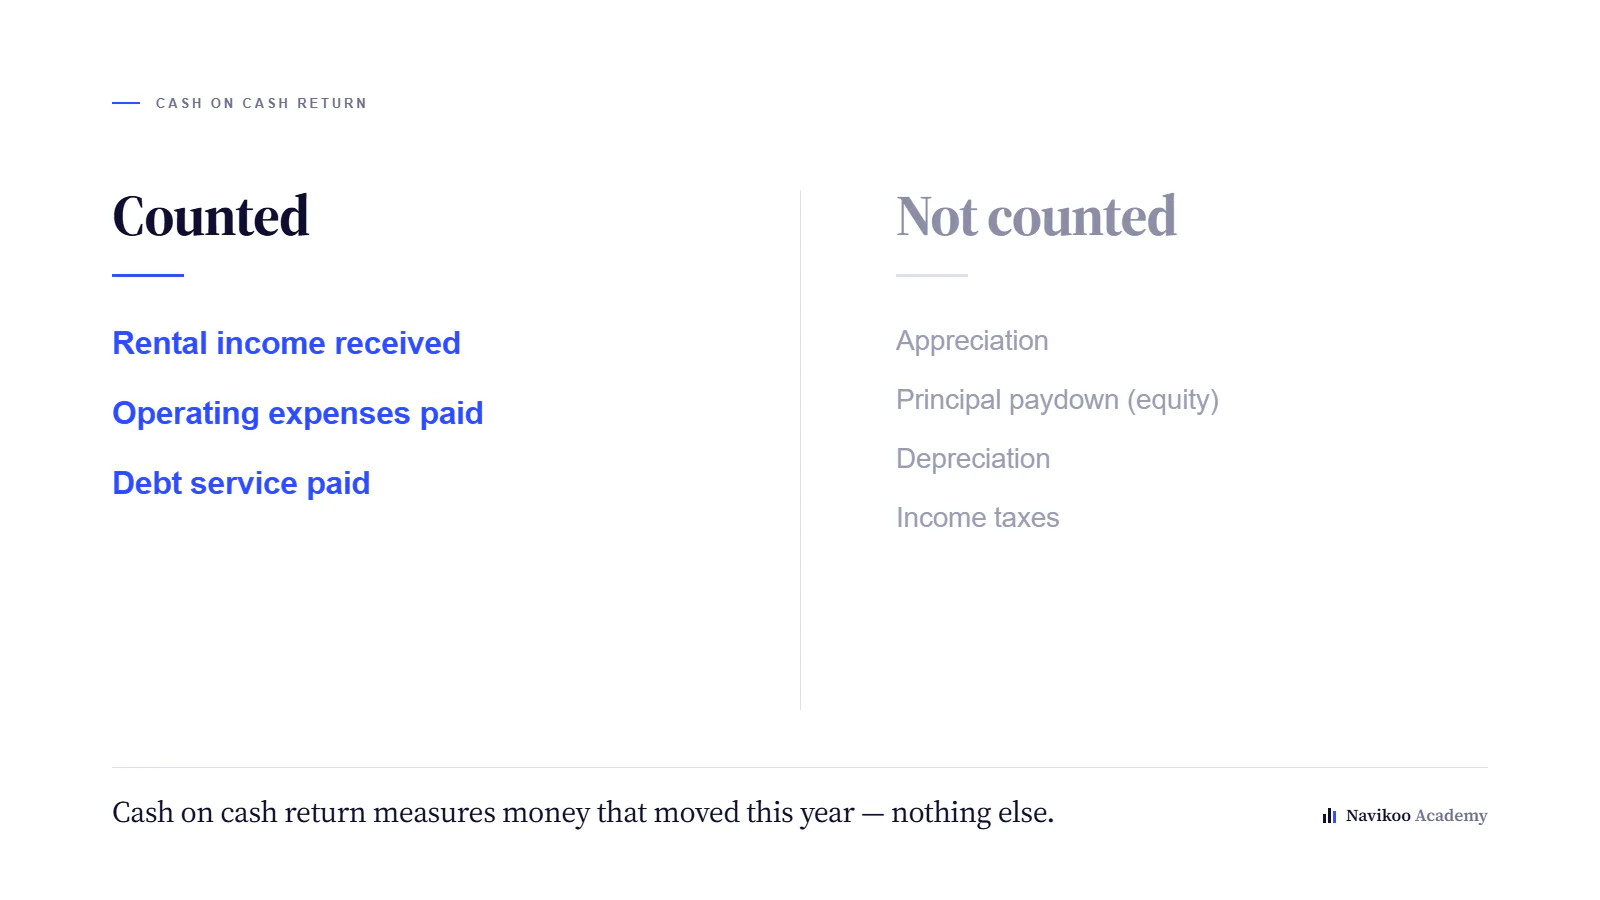
That word cash is doing deliberate work. This is a cash basis calculation, so it counts money that moves. It ignores appreciation, because nobody has been paid yet. It ignores the equity built through principal paydown, because that equity is real but illiquid. It ignores depreciation, because no cash left the account. And it stops before taxes, since two owners in different brackets holding identical assets would otherwise report different results for the same property.
What makes the metric useful for investors is that narrowness. Most return metrics blend several sources of value into one figure and obscure which one is doing the work. Other metrics answer larger questions; the cash return answers a smaller one precisely, and isolates the part that shows up in a bank account.
How Is Cash-on-Cash Return Calculated?
The formula has two inputs, and both are easier to get wrong than they look.
What Counts as Annual Pre-Tax Cash Flow
Start with gross rental income, subtract vacancy to reach effective income, then subtract operating expenses to arrive at net operating income. From there, subtract annual debt service.
Operating expenses include property taxes, insurance, maintenance, management, owner-paid utilities, and reserves for capital items. They exclude mortgage payments, which is the distinction separating a cash return calculation from a property-level yield.
What remains is annual cash flow before taxes, sometimes called net cash flow. It is the money left after the property has paid its bills and its mortgage, and it is the numerator of every cash return that follows.
What Counts as Total Cash Invested
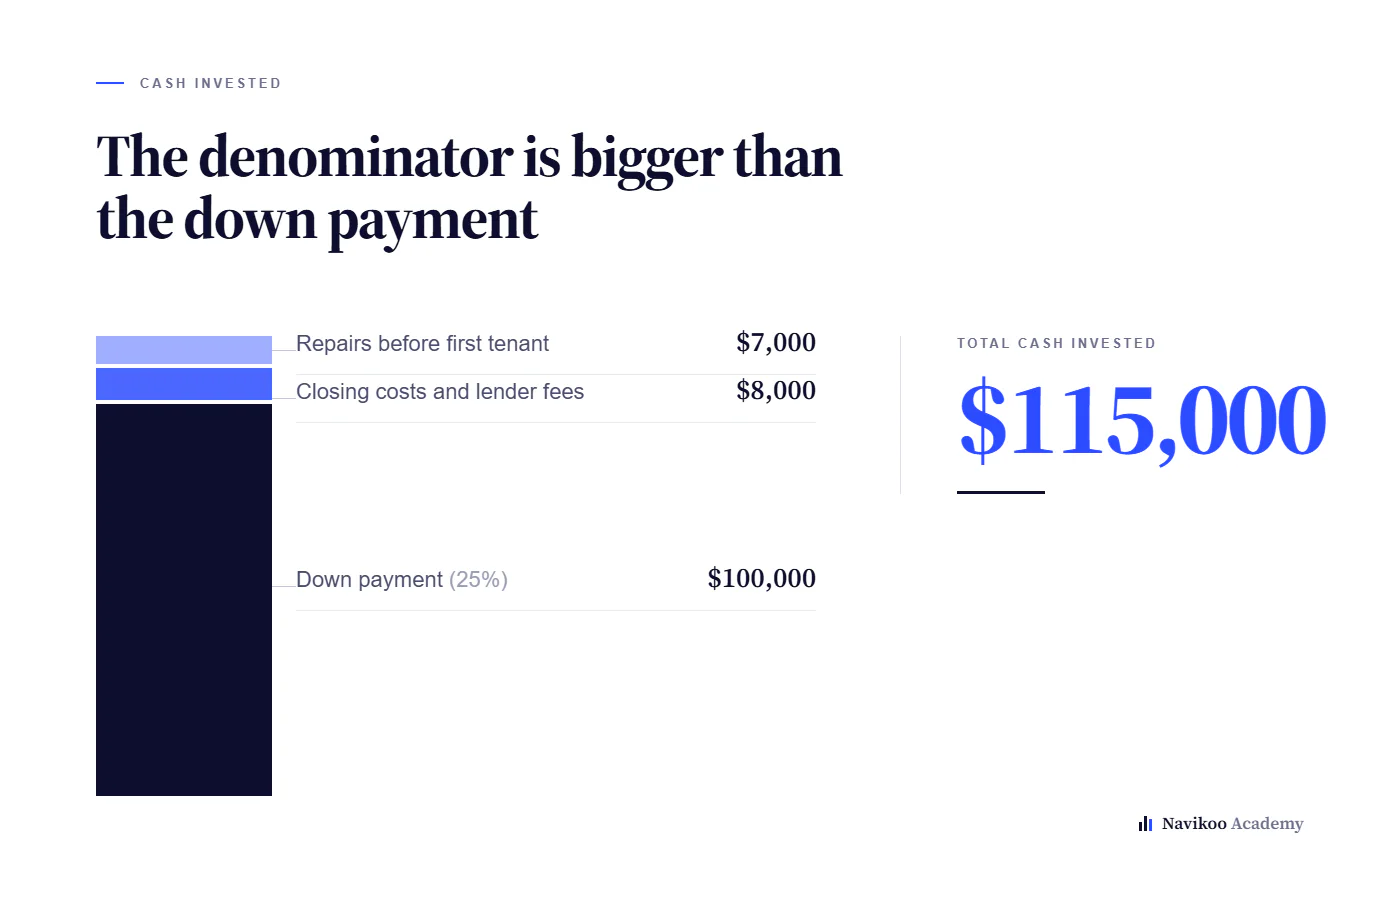
This is where most errors live. Total cash investment is not the down payment. It is every dollar required to take ownership and reach a rentable condition:
Down payment
Closing costs, lender fees, and points
Inspections and due diligence
Immediate repairs or turnover work before the first tenant
Any upfront reserve required to close the investment property loan
Leaving $15,000 of make-ready work out of a $100,000 down payment inflates the cash return by roughly 15%. The denominator is the quieter half of this equation, and the one worth auditing twice.
A Worked Cash on Cash Return Example
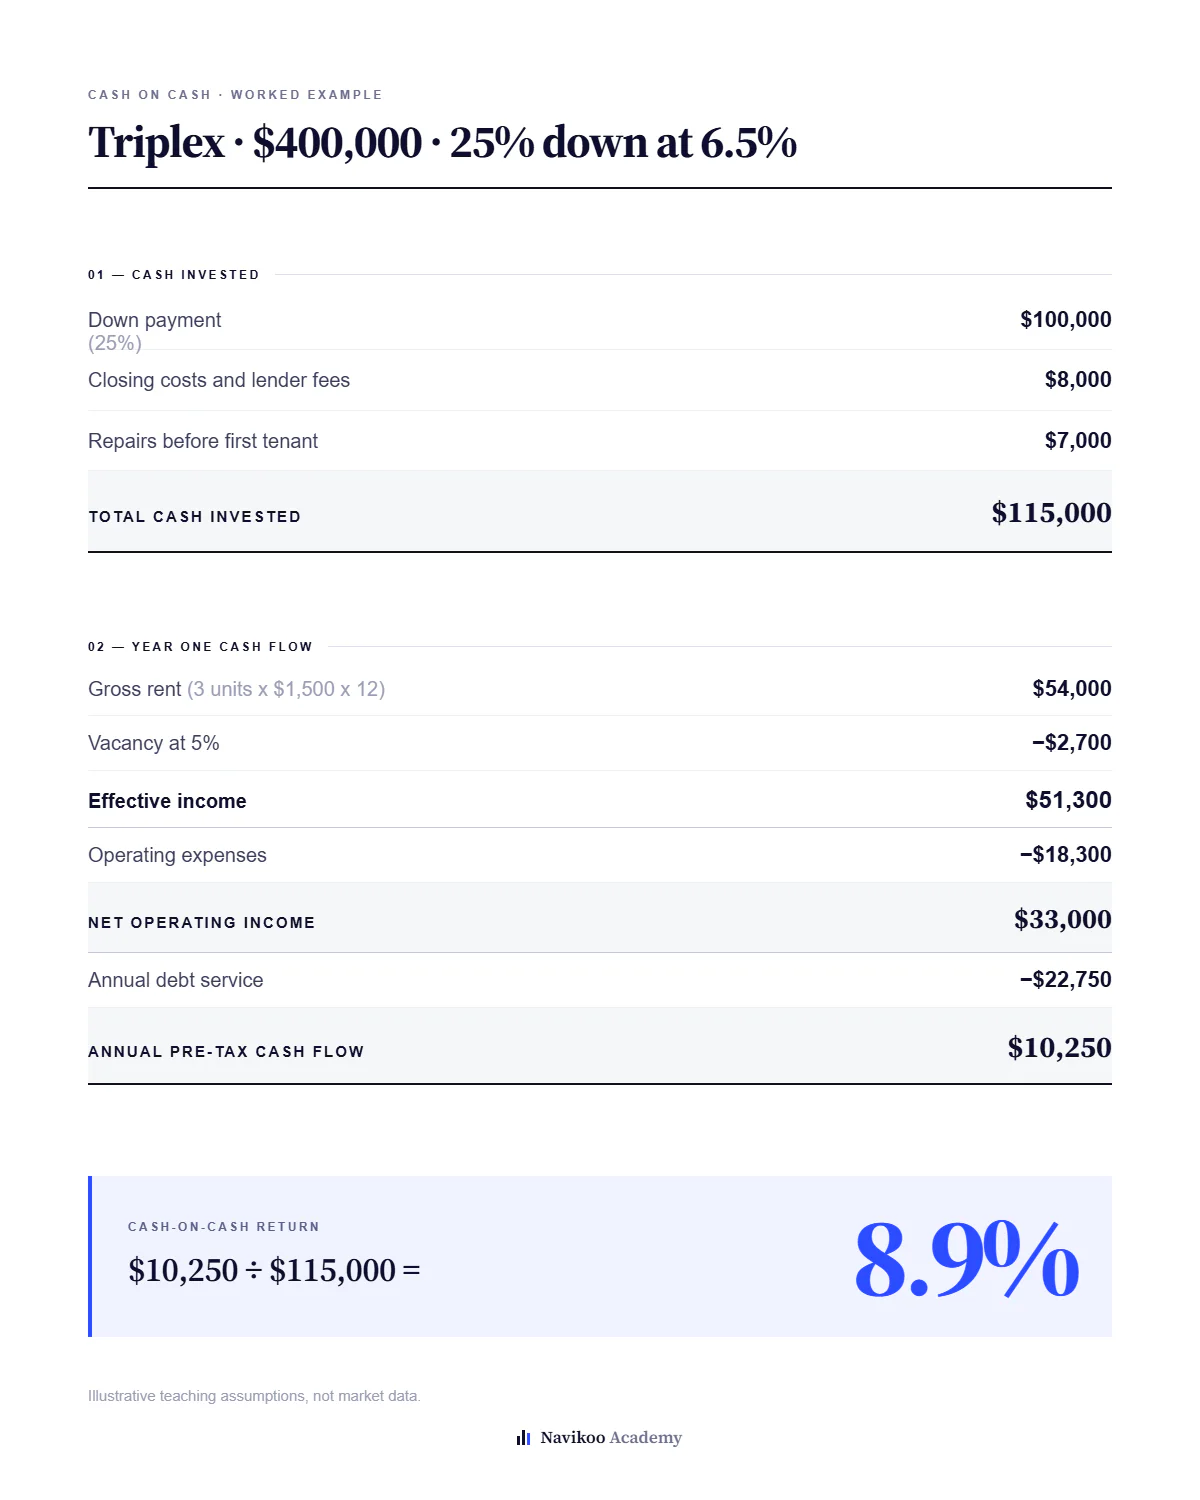
Small multifamily is where most real estate investors meet this calculation for the first time. Consider a triplex at $400,000, financed with 25% down on a 30-year mortgage at an illustrative 6.5%. The figures below are teaching assumptions rather than market data.
Cash required to acquire it
Item | Amount |
|---|---|
Down payment (25%) | $100,000 |
Closing costs and lender fees | $8,000 |
Repairs before first tenant | $7,000 |
Total cash invested | $115,000 |
What the property produces in year one
Item | Amount |
|---|---|
Gross rent (3 units × $1,500 × 12) | $54,000 |
Vacancy at 5% | −$2,700 |
Effective income | $51,300 |
Operating expenses | −$18,300 |
Net operating income | $33,000 |
Annual debt service | −$22,750 |
Annual pre-tax cash flow | $10,250 |
$10,250 ÷ $115,000 = 8.9%
Understanding Your Cash on Cash Formula
That 8.9% carries a precise meaning and a great deal it does not mean.
The cash on cash return says the position produced roughly nine cents of spendable cash for every dollar committed, during the first twelve months, before taxes. It does not say the real estate investment earned 8.9%. Over that same year tenants also paid down several thousand dollars of principal, quietly adding equity, and the asset may have gained or lost value. Neither shows up in the calculation.
A first-year cash return also describes one year under one set of assumptions. Rents change, insurance renews, a roof eventually fails. The figure is a snapshot taken at purchase, and the further a deal travels from that moment the less the original number describes it.
The comparison worth making is against alternatives carrying similar risk and demanding similar effort. An 8.9% cash return on a stabilized triplex and an 8.9% cash return on a heavy renovation in a thin rental market are not equivalent outcomes, even when the arithmetic matches.
What Does Cash-on-Cash Return Tell You?
Practically, three things.
It shows whether a deal produces liquidity or consumes it. Some properties are worth owning while running slightly negative, on a credible investment thesis about rent growth or repositioning. Many are not. This cash return metric surfaces that distinction immediately.
It shows how hard invested capital is working relative to other uses. Money in one property is money not in another, and a cash return puts competing investment options on comparable footing. Sponsors doing capital raising lean on it heavily for the same reason: it translates a complex deal into a figure a passive partner can weigh against alternatives.
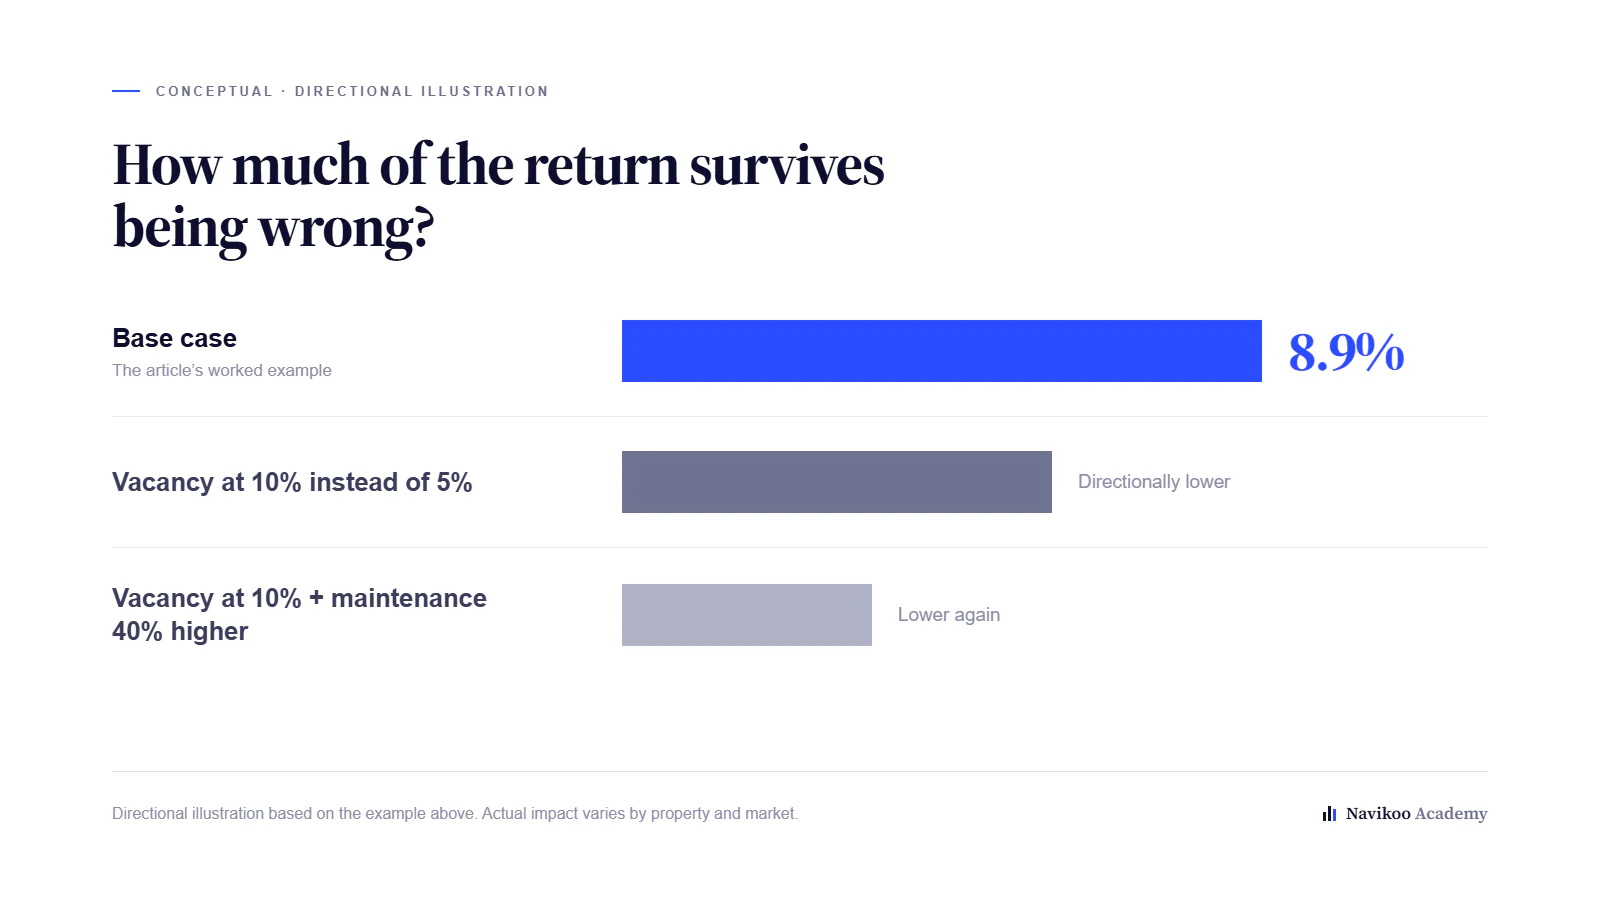
And it shows how sensitive a deal is to being wrong. Run the same math at 10% vacancy instead of 5%, or with maintenance 40% higher, and watch how much of the cash return survives. Deals holding up under pessimistic assumptions are structurally different from deals that only work when everything goes right, even when both display the same headline percentage, which is why experienced buyers stress-test an investment before committing to it.
How Financing Changes the Number
Here the metric diverges most sharply from a property-level yield, and a good deal of confusion clears up at once.
The triplex above produces $33,000 of NOI against a $400,000 price, so its capitalization rate is 8.25% no matter how it is bought. Cap rate is a property-level measure and ignores leverage entirely. A cash return responds to the capital structure directly, because debt reshapes both halves of the fraction.
The Same Property, Bought Four Ways
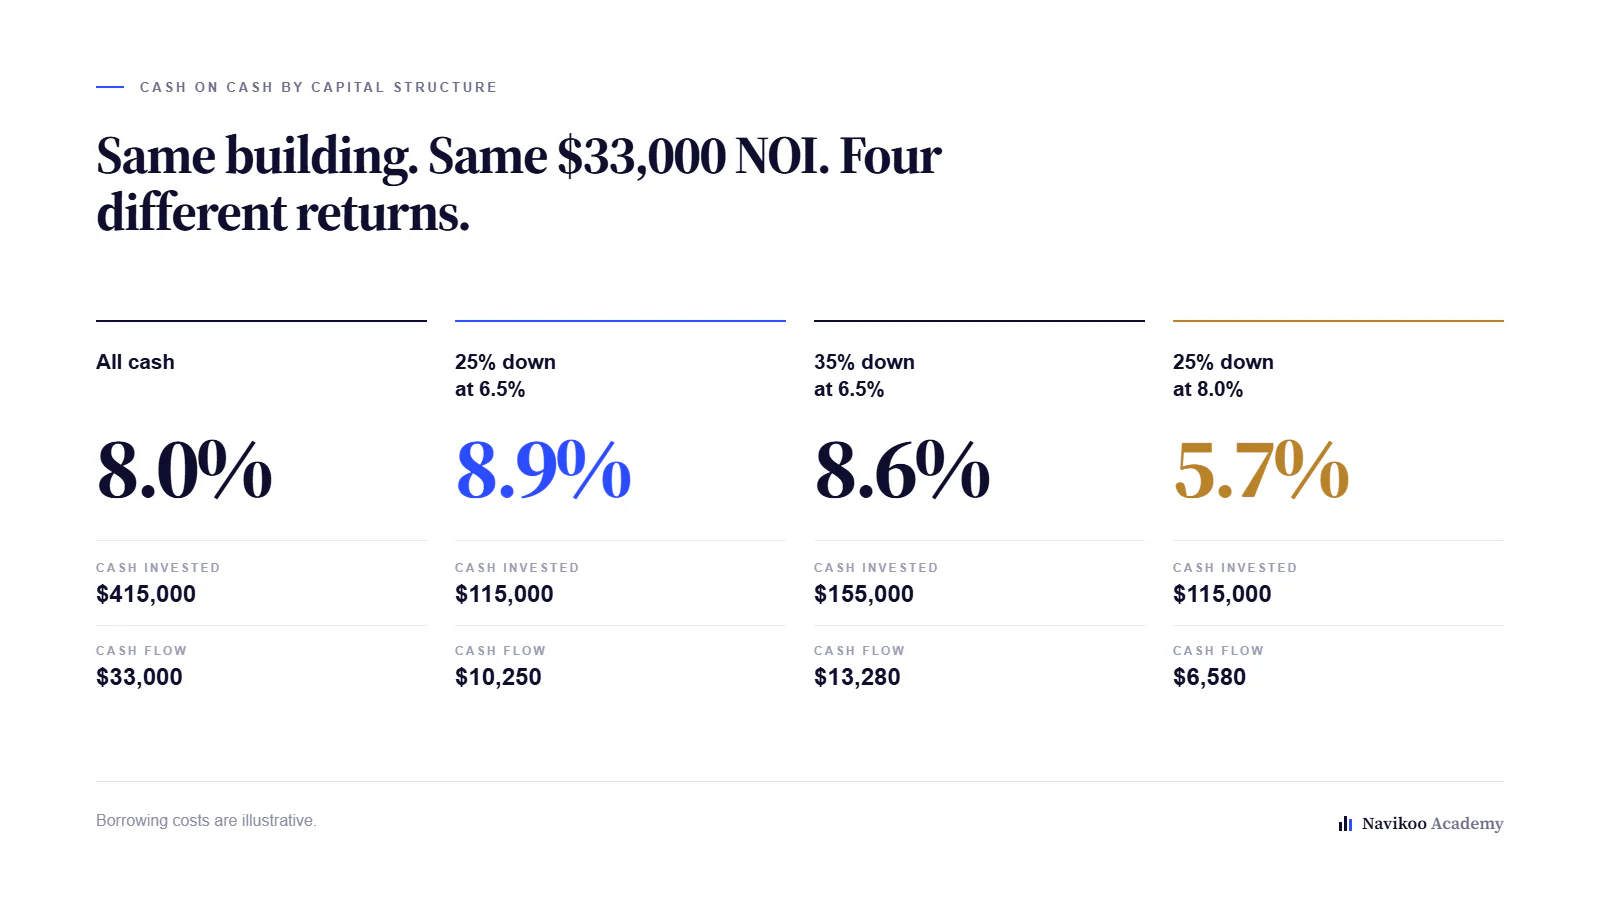
Same building, same income, same expenses. Only the capital structure changes. Borrowing costs shown are illustrative.
Structure | Cash invested | Annual debt service | Pre-tax cash flow | Cash-on-cash |
|---|---|---|---|---|
All cash | $415,000 | $0 | $33,000 | 8.0% |
25% down at 6.5% | $115,000 | $22,750 | $10,250 | 8.9% |
35% down at 6.5% | $155,000 | $19,720 | $13,280 | 8.6% |
25% down at 8.0% | $115,000 | $26,420 | $6,580 | 5.7% |
Two patterns deserve attention.
Borrowing at 6.5% lifted the cash return above the all-cash result, while borrowing at 8.0% pushed it well below. The dividing line is the loan constant, meaning the annual payment divided by the loan balance. At 6.5% that constant sits near 7.6%, comfortably under the property's 8.25% cap rate, so each borrowed dollar earns more than it costs. At 8.0% the constant climbs to roughly 8.8%, above what the asset yields, and leverage begins working against the buyer. Financing options are not neutral packaging around a real estate investment; they are part of it, and the cash return moves with them.
Notice also that the largest cash flow and the best percentage belong to different rows. The 35% down structure generates $13,280 a year, more than any other financed option, yet returns a lower cash yield because it ties up $40,000 more. Buyers optimizing for monthly cash flow and those optimizing for capital efficiency read this table differently, and both readings are defensible. Principal paydown quietly converts some of that annual cash flow into equity regardless of which row an investor chooses.
What Is a Good Cash on Cash Return?
There is no universal threshold, and anyone quoting one without context is describing their own investment strategy rather than a rule of real estate investing.
A reasonable cash return target depends on the risk absorbed, the market, the property type, the investment horizon, prevailing borrowing costs, and what the same investment capital could earn elsewhere. A stabilized building in a strong submarket delivering a modest, dependable return can be a better position than a higher-yielding property in a market with thin tenant demand and volatile expenses. The percentage alone does not distinguish between them.
Because this figure moves with borrowing costs, targets that made sense in one lending environment become unreachable in another without changing the deal itself. Real estate investment advisors and lenders generally frame acceptable returns against current debt costs for exactly that reason.
Is 7% Cash-on-Cash Return Good?
It depends entirely on what generated it, what was risked to get it, and what the investment is expected to do across the hold.
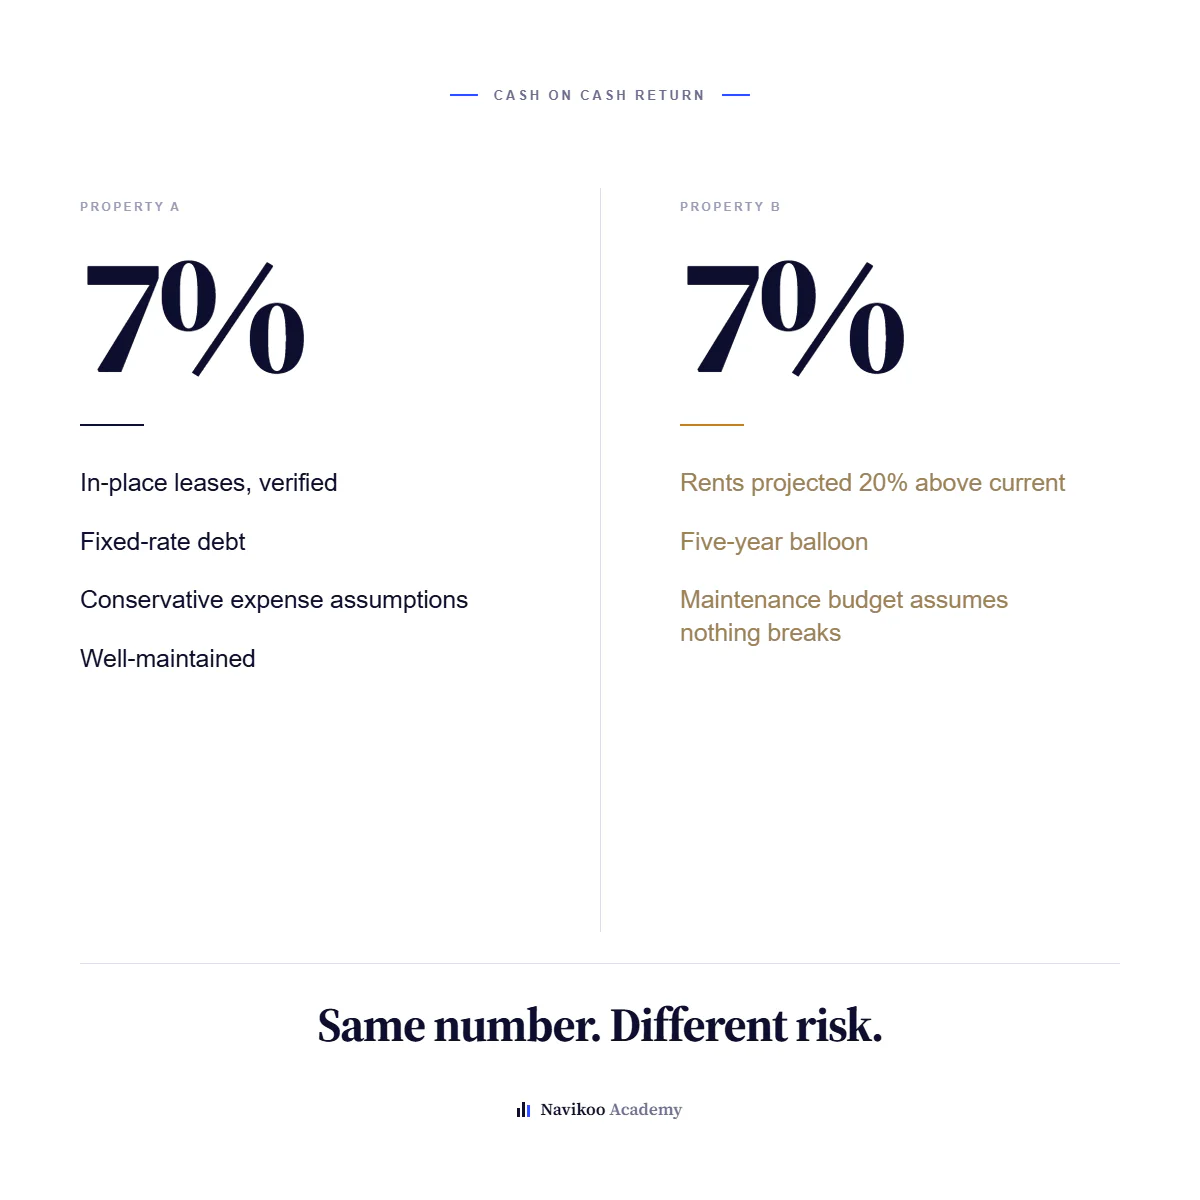
A 7% cash on cash return on a well-maintained property with in-place leases, fixed-rate debt, and conservative expense assumptions is a solid outcome. The same 7% built on projected rents 20% above current ones, a five-year balloon, and a maintenance budget assuming nothing breaks is a considerably weaker position wearing an identical number.
Better questions: what happens to that 7% if vacancy runs higher than modeled, whether the assumptions came from the seller or from independent verification, and how it compares to similar deals in the same market rather than to a benchmark borrowed from a different real estate market.
Cash on Cash Return vs. Cap Rate
These two metrics get treated as interchangeable and measure genuinely different things.
Cash-on-cash return | Cap rate | |
|---|---|---|
What it measures | The investor's position | The property itself |
Includes debt | Yes | No |
Formula | Pre-tax cash flow ÷ cash invested | NOI ÷ market value |
Changes with financing | Yes | No |
Best used for | Evaluating a specific structure | Comparing properties |
Cap rate answers whether a building is priced sensibly against comparable buildings, which is why it dominates commercial property valuation. Cash on cash answers whether a particular purchase, financed a particular way, makes sense for a particular buyer. Real estate analysis worth the name uses both, because each answers what the other cannot.
What's the Difference Between ROI and Cash on Cash?
Return on investment is the broader measure. It accounts for every source of gain across the life of the investment, including cash flow, principal reduction, tax treatment, and appreciation realized at sale. A cash return deliberately excludes all of it.
The practical consequence: a property can deliver a modest cash return while producing a strong total return, because amortization and equity growth accumulate quietly in the background. The reverse is equally common in real estate. A property can throw off healthy cash while sitting in a market where values stay flat and the eventual exit disappoints.
Where Internal Rate of Return Fits
Internal rate of return goes further by weighing when money arrives, not merely how much. A dollar returned in year one is worth more than a dollar returned in year seven.
For a straightforward buy-and-hold rental, the cash return is often sufficient as a first read. For deals with uneven cash flow, a planned refinance, or a defined exit, the ranking of opportunities can change once timing enters the analysis.
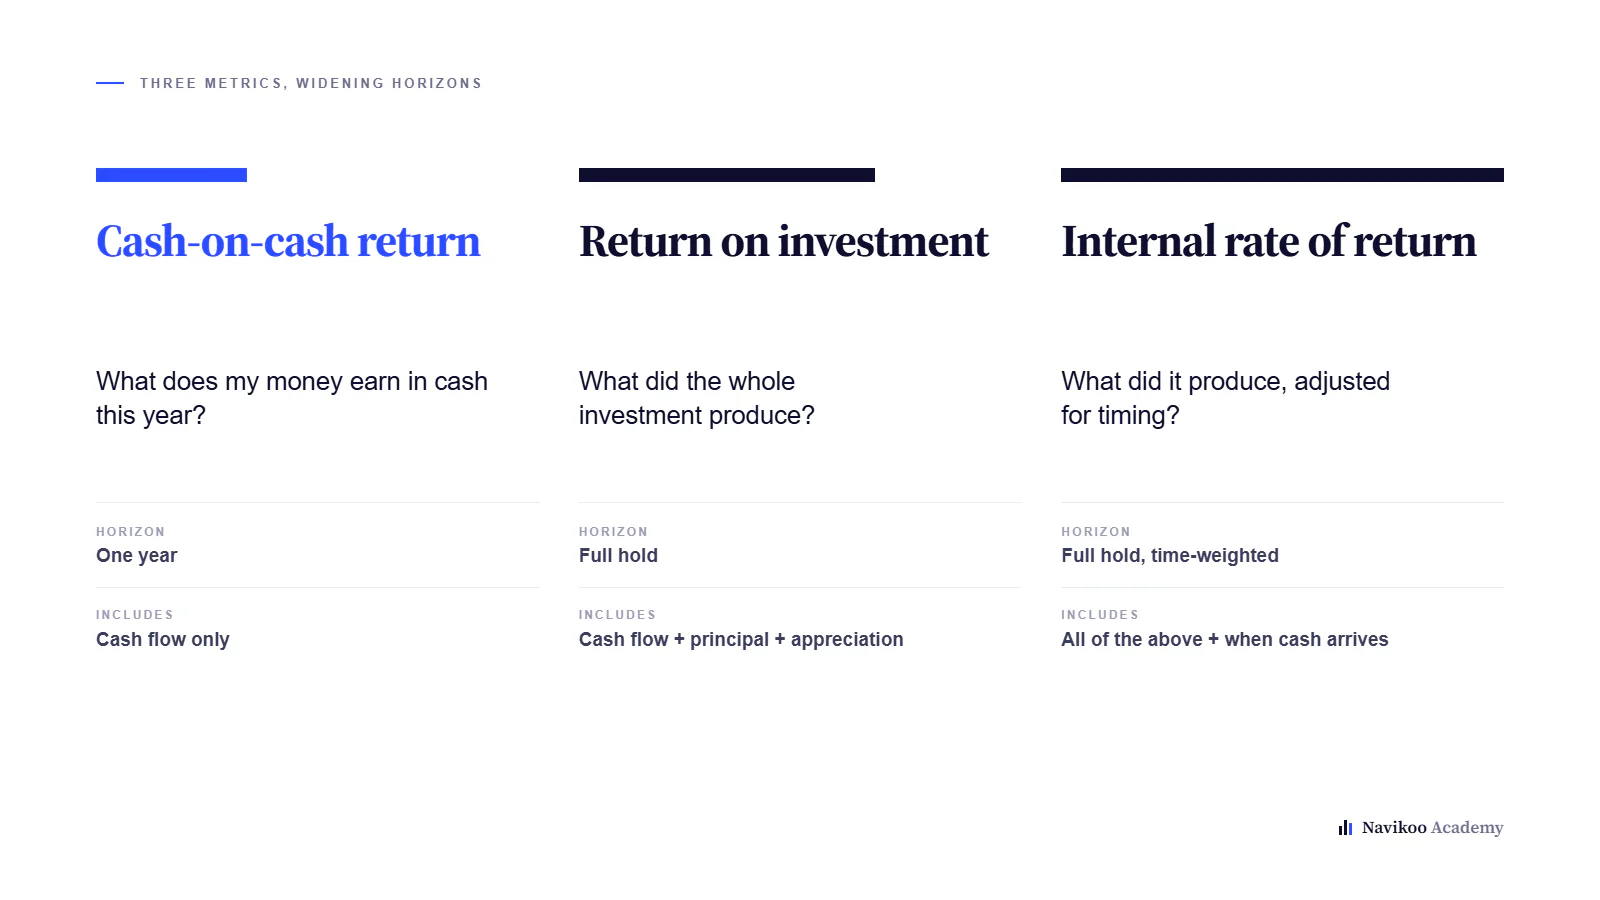
Metric | Question it answers | Horizon |
|---|---|---|
Cash-on-cash return | What does my money earn in cash this year? | One year |
Return on investment | What did the whole investment produce? | Full hold |
Internal rate of return | What did it produce, adjusted for timing? | Full hold |
Experienced buyers watch all three metrics rather than committing to one.
Where the Metric Misleads Real Estate Investors
Most misuse in real estate underwriting traces to three habits.
Year One Is Not Every Year
The figure is almost always built on first-year projections, the least representative year of any hold. Turnover costs, rent adjustments, insurance renewals, and deferred maintenance surfacing in year three all move the cash that actually arrives. Investors who run the calculation once at purchase and never revisit it are working from a number with a short shelf life.
Seller Numbers Are Not Your Numbers
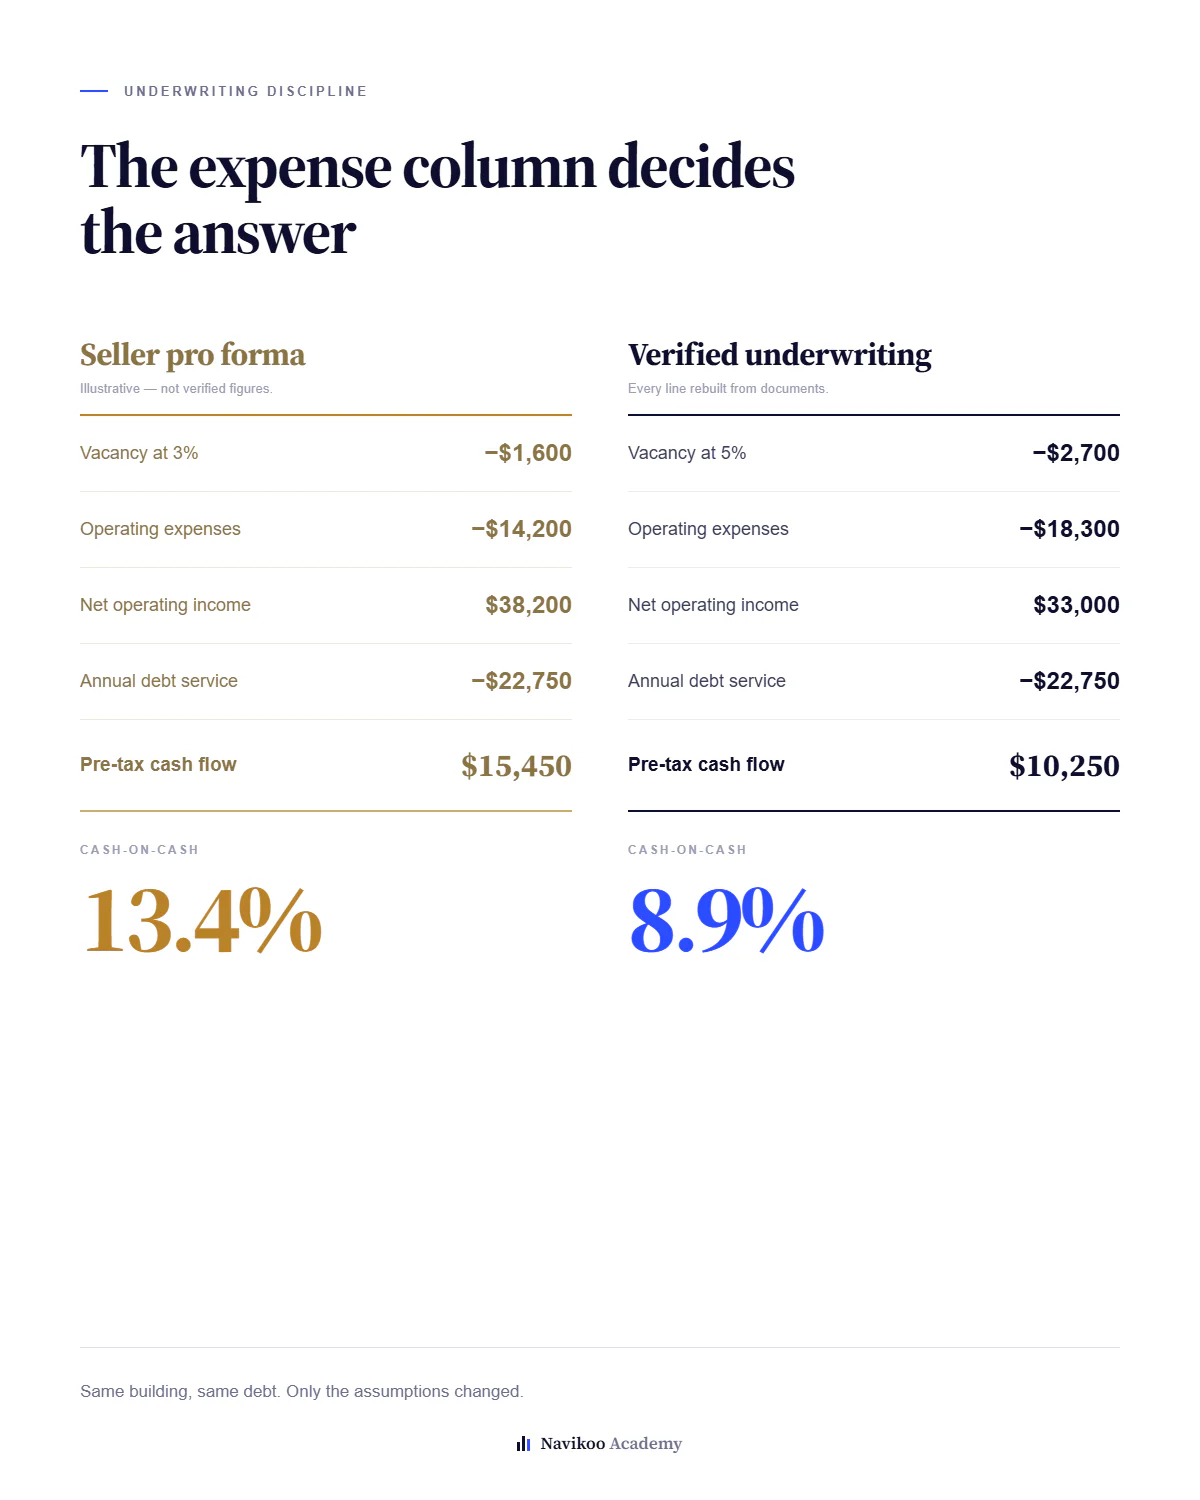
Listing packages present operating expenses under favorable assumptions, often understating maintenance and management, sometimes reflecting an owner who self-manages. Rebuilding the expense side independently frequently moves the result by two or three percentage points. Two similarly priced properties can produce very different cash flow simply because one seller underwrote honestly and the other did not.
One Metric Cannot Carry a Decision
A high cash yield on a property with a failing roof, a concentrated employment base, or a lease expiring in eight months is not the same opportunity as an identical percentage on a stable building. A cash return measures one dimension of investment performance well and stays silent on the others. Smart investing treats it as one input among several rather than a verdict on a potential investment.
What to Verify Before Trusting the Number and your Analysis
The formula is trivial. The assumptions underneath decide whether the output means anything, and a handful deserve direct scrutiny.
Verify rental income against actual leases and payment history rather than a rent roll or market survey. Rebuild operating expenses from tax records, real insurance quotes, and a maintenance figure appropriate to the building's age. Confirm every acquisition cost belongs in the denominator, including repairs before the first tenant. Model the deal at higher vacancy and higher expenses to see what survives, since that is what separates an investment decision from a guess. Then check the loan constant against the property's yield to learn whether the leverage helps or hurts.
Once those inputs are defensible, a cash on cash return earns its keep in real estate underwriting: fast enough to screen dozens of listings, precise enough to compare financing structures on a single property, and honest enough to expose an investment that only works on paper. Investors modeling how rent, vacancy, leverage, and expenses interact can test those assumptions together in Navikoo's Rental Property Calculator, which tends to be more informative than solving for one variable at a time.
After closing, the question shifts from real estate investment analysis to asset management, where actual cash results get measured against the underwriting that justified the purchase. Repeated across several real estate deals, that comparison teaches more about accurate assumptions than any single calculation ever will.
Explore more real estate investing guides from Navikoo.