What Is a Cap Rate in Real Estate?
Learn what cap rate means in real estate, how to calculate it, what a good cap rate looks like, and where this metric can mislead investors.

Walk into any real estate meetup and you'll hear it inside of five minutes. "What's the cap rate on that one?" People nod. Someone says 7.5%. Everyone reacts like that means something.
It does mean something. It's also simpler than the room makes it sound.
The capitalization rate, or cap rate, tells you what a property earns in a year compared to what it costs to buy. That's it. One number, one percentage, one quick read on whether a deal deserves a second look.
This guide walks through the formula, a worked example you can copy, what counts as good right now, and the places where this number quietly lies to you. By the end you'll read cap rates the way experienced investors do.
The Short Answer, in Plain English
A cap rate is the annual return a property would produce if you paid cash for it.
No mortgage. No loan. Just the building, the rent it collects, the bills it pays, and the price on the contract.
Say a property throws off $40,000 a year after expenses and costs $500,000. Divide one by the other and you get 8%. That's your cap rate.
Real estate investors love this number because it strips away everything personal. Your credit score doesn't touch it. Your down payment doesn't touch it. Two buyers looking at the same building land on the same capitalization rate, which makes it a clean way to put very different real estate investment options on one scale.
That's also why cap rates show up in every listing sheet, every broker call, and every real estate school curriculum in the country.
The Cap Rate Formula
Formula and examples:
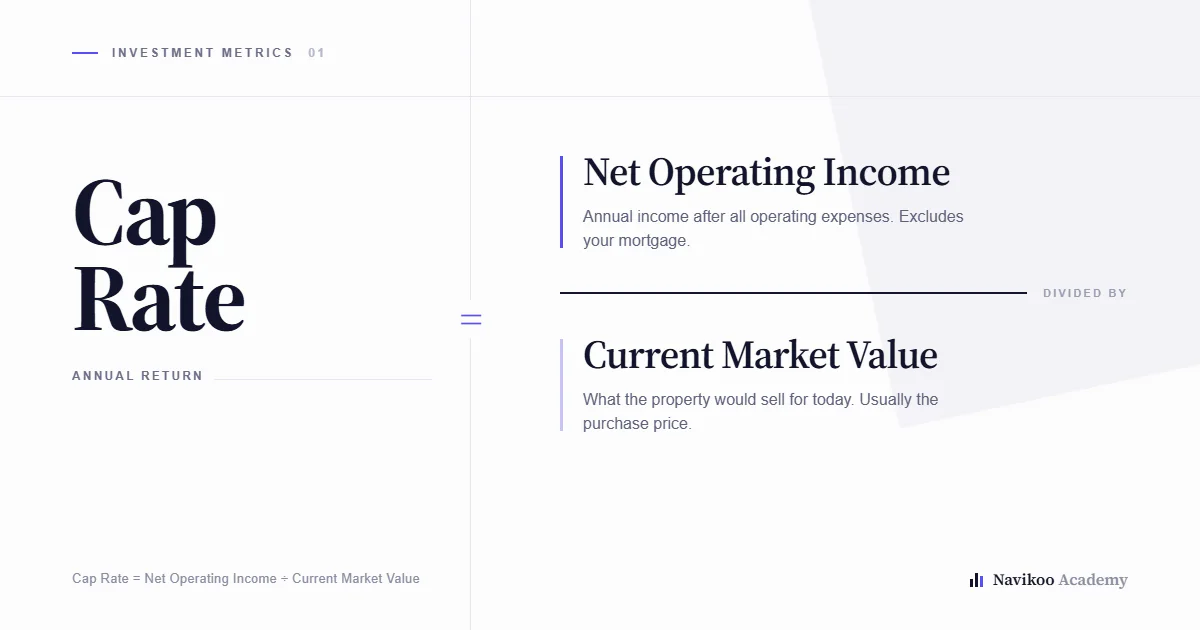
Cap Rate = Net Operating Income ÷ Current Market Value
That's the basic formula. Two inputs. One is easy to find, and one is where people go wrong.
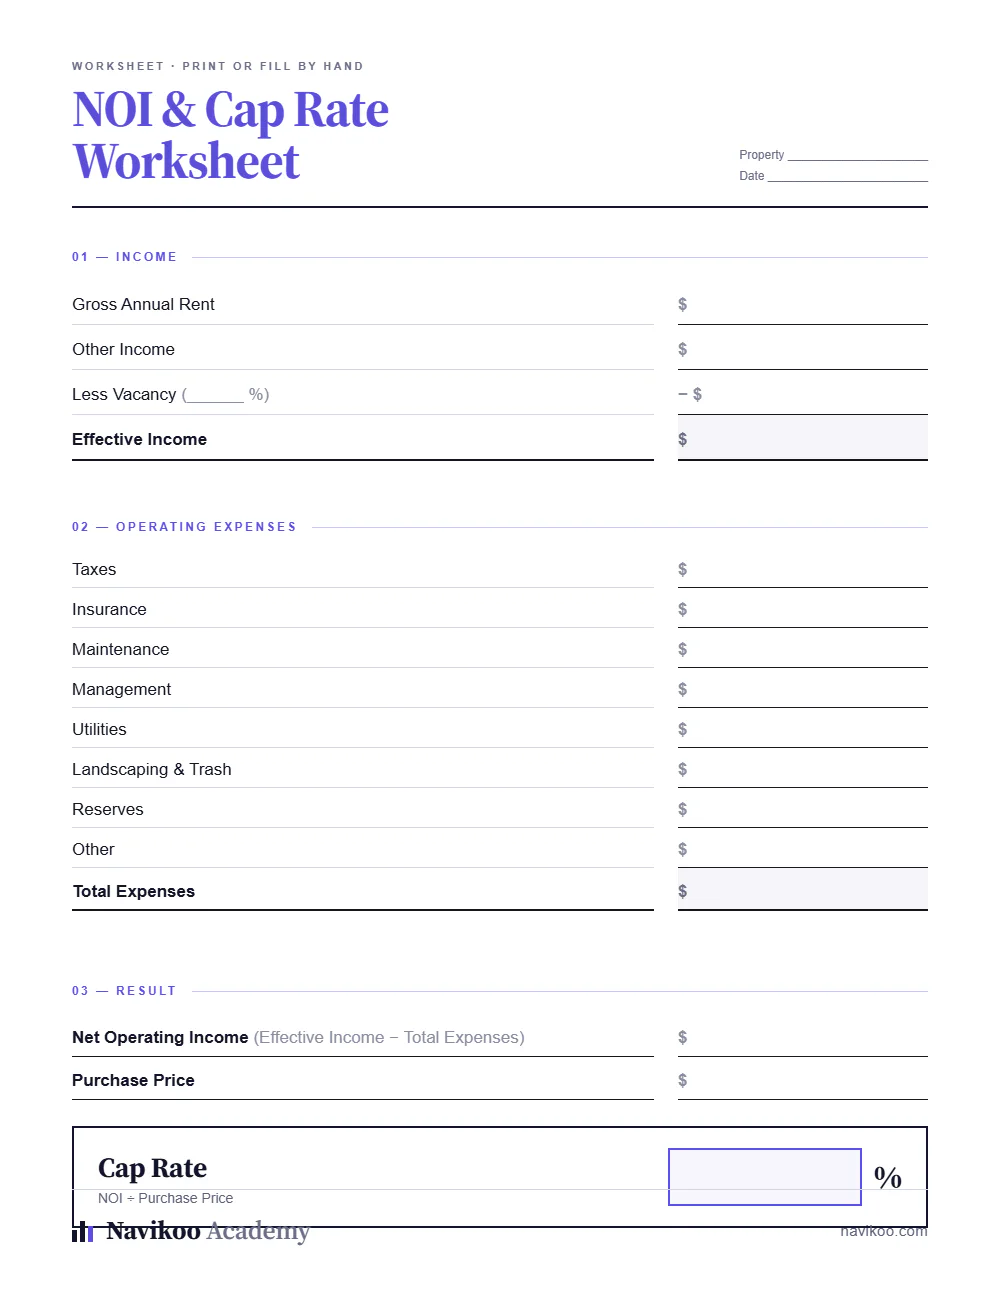
Step 1: Calculate Net Operating Income
Net operating income is the money left over after the property pays its own bills for a year.
Start with the gross rent, meaning everything the building collects at full occupancy. Then subtract vacancy, because nothing rents 100% of the time. Five to eight percent is a normal haircut in most markets, higher where demand areas are thin.
Now subtract operating expenses:
Property taxes
Insurance
Property maintenance and repairs
Management fees
Utilities the owner covers
Landscaping, trash, pest control, snow removal
A reserve for the roof and HVAC you'll eventually replace
What you do not subtract is your loan payment, principal, depreciation, or personal taxes. Those belong to you, not to the building. Leave them out or the number stops being comparable.
What's left is your NOI, and the whole calculation rests on it.
Step 2: Divide by Current Market Value
The denominator is the property's current market value. If you're buying today, that's usually the purchase price.
If you already own the asset, use what it would sell for now, not what you paid in 2019. Capitalization rates on properties you hold are supposed to move as market value moves. That's the point of tracking them.
A Cap Rate Calculation Example
Numbers make this click faster than definitions do. Let's price a small fourplex.
The property: four units listed at $500,000, each renting for $1,250 a month.
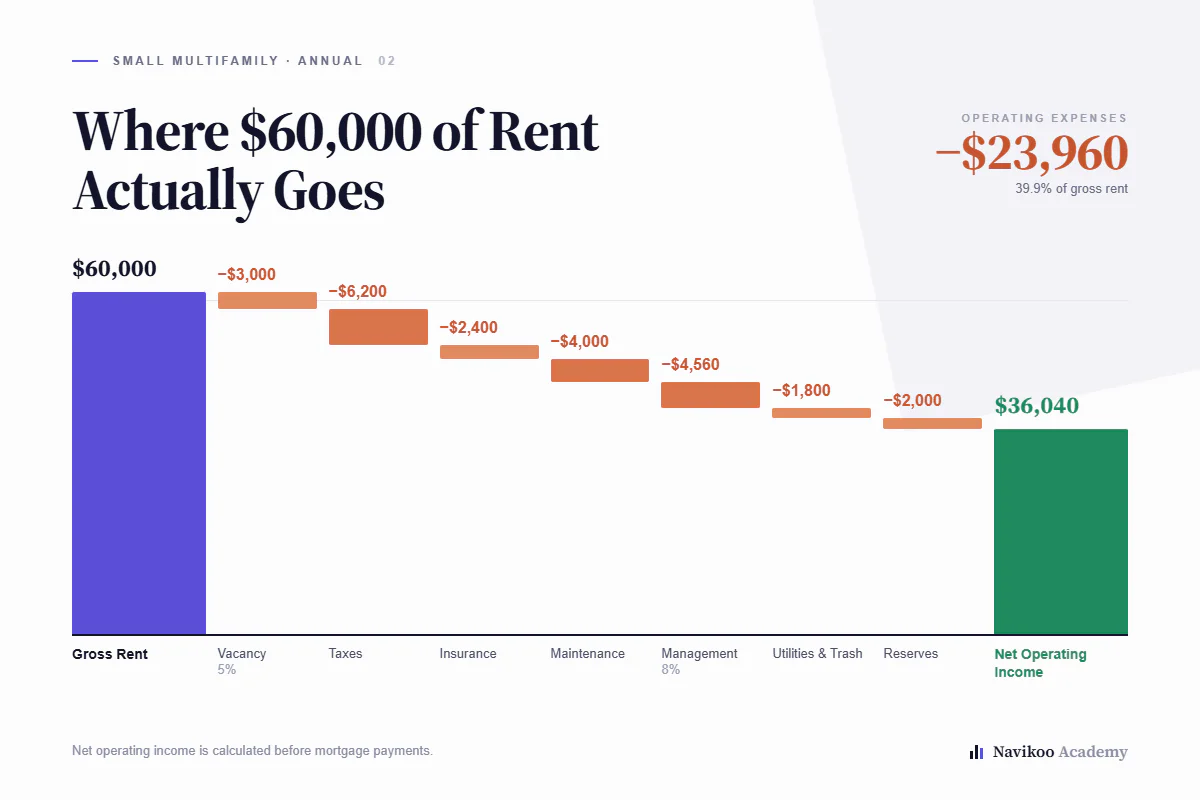
Gross rent: $1,250 × 4 units × 12 months = $60,000 Vacancy at 5%: minus $3,000 Effective income: $57,000
Now the expense column:
Expense | Annual cost |
|---|---|
Taxes | $6,200 |
Insurance | $2,400 |
Maintenance and repairs | $4,000 |
Management (8%) | $4,560 |
Utilities and trash | $1,800 |
Reserves | $2,000 |
Total | $20,960 |
Net operating income: $57,000 − $20,960 = $36,040 Cap rate: $36,040 ÷ $500,000 = 7.2%
That fourplex carries a 7.2% capitalization rate. Pay cash for it and you'd expect roughly 7.2% back in year one, before financing and before taxes.
Notice how much of the work happened in the expense column. Most bad deals aren't bad because somebody divided wrong. They're bad because somebody guessed at maintenance and skipped reserves entirely.
What Happens When the Price Changes
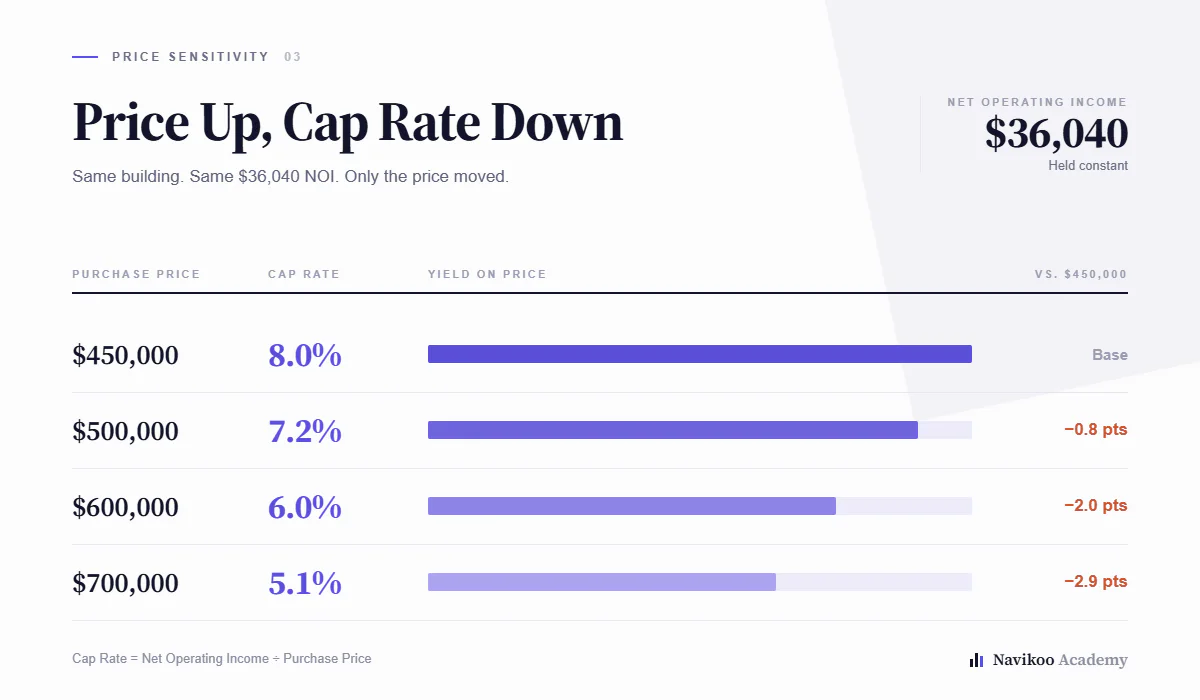
Keep the same building. Change nothing about the income. Just move the price.
At $450,000, the cap rate is 8.0%
At $500,000, it's 7.2%
At $600,000, it's 6.0%
At $700,000, it's 5.1%
Same roof, same tenants, same rental income. Price goes up, the cap rate goes down. The two always move in opposite directions.
Flip it around and it turns into a property valuation tool. If similar buildings nearby trade at a 7% capitalization rate and yours produces $36,040 of NOI, then $36,040 ÷ 0.07 = $514,857. That's roughly what the asset value should be.
This is the backbone of commercial real estate appraisal, and it's why raising rents a few hundred dollars a month can add tens of thousands to what a building is worth. Small income gains get multiplied.
What Is a Good Cap Rate?
The honest answer is that it depends on what you're being paid to tolerate.
A cap rate is priced risk. Low numbers show up on buildings people feel safe about. High numbers show up where something makes buyers nervous, whether that's the neighborhood, the tenant quality, the age of the roof, or the local job market.
A 4% cap rate downtown and a 10% cap rate two hours out aren't a good deal and a bad deal. They're two different jobs. Cap rates are a market's way of pricing uncertainty, and investors read them that way.
Most real estate deals land at a capitalization rate between 5% and 10%. Below 5%, you're usually betting on appreciation and rent growth rather than current cash flow. Above 10%, ask hard questions, because that kind of profitability is rarely free.
Set a target return on your investment before you shop, not after, and hold the rate of return you need in mind on every walkthrough.
The better question isn't which number is good in the abstract. It's whether the deal clears your own required rate of return, given your investment criteria, your timeline, and how much risk you can sleep next to.
What is a good cap rate in real estate by property type?
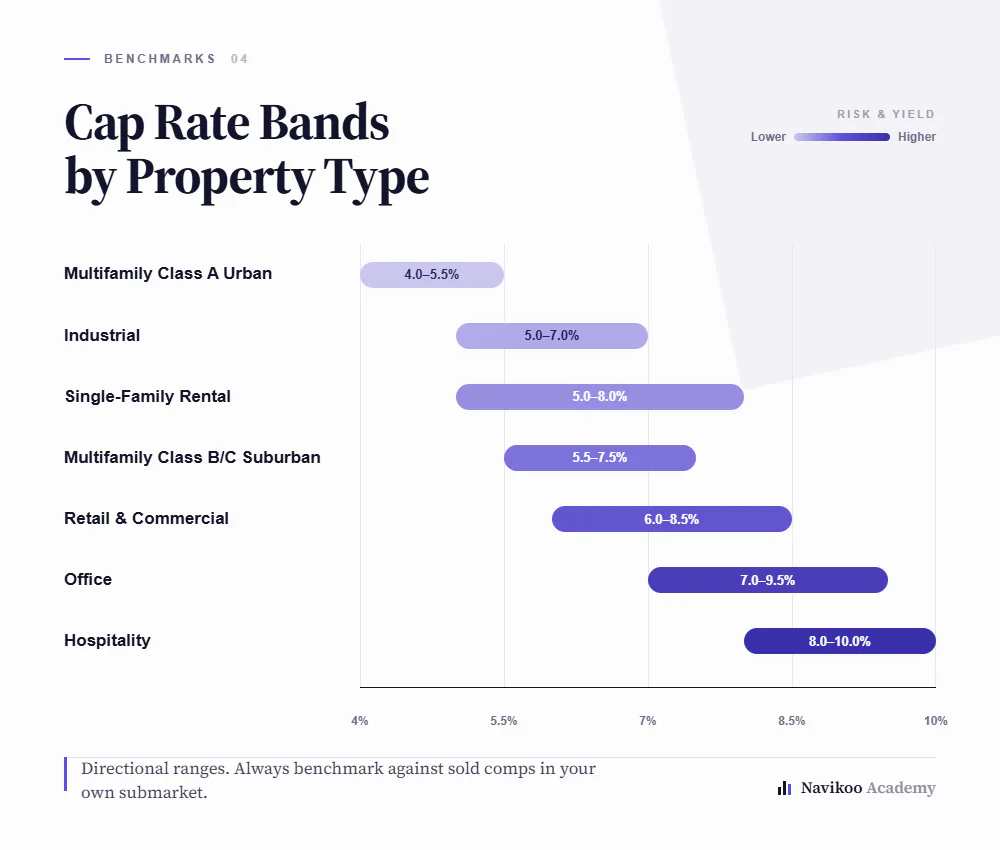
Different property types trade in different bands, because each one carries its own investment risk profile. Rough ranges investors use as a starting point:
The ranges below are broad educational examples, not current market benchmarks. Actual cap rates vary materially by location, asset quality, lease structure, and market conditions.
Multifamily, Class A urban: 4% to 5.5%
Multifamily, Class B and C suburban: 5.5% to 7.5%
Single-family rental property: 5% to 8%
Retail and commercial properties: 6% to 8.5%
Office: 7% and up, with a wide spread by submarket
Industrial: 5% to 7%
Hospitality: 8% and up
Treat these as a compass, not a map. A real estate cap rate shifts with borrowing costs, local demand, and the phase of the cycle. What looked like a steal at 6% three years ago might be ordinary today.
The only ranges that truly matter are the ones your own real estate market produced in the last ninety days. Pull recent sold comps of different properties in your submarket, run the math on each, and build your own benchmark. Sharp real estate agents and appraisers do exactly this.
High and Low Cap Rates Both Tell a Story
A high number is not automatically a win.
Think about what pushes it up. A seller who can't find a buyer. Deferred repairs nobody wants to inherit. Tenants who pay late. A town where the largest employer just left. The market prices those problems into what people will pay, which lifts the percentage.
Low cap rates carry their own warning. You're paying a premium for stability and accepting thinner current returns to get it. If rents flatten or expenses jump, there's very little cushion between you and a negative month. Neither end is right or wrong, so just know which trade you're making before you sign.
The Impact of Interest Rates on Cap Rates
Cap rates don't float free. They sit in a market where financial institutions price money every single day.
When borrowing gets cheaper, buyers can pay more for the same income stream, and cap rates compress. When interest rate hikes arrive, debt costs more, buyers bid less, and cap rates expand. That expansion shows up as lower values even when the building's performance never changed.
It's why two identical properties sold three years apart can trade at completely different cap rates. Nothing about the roof changed. The cost of capital did, and every real estate valuation in the market moved with it.
J.P. Morgan's overview of The Impact of Interest Rates on Cap Rates walks through this with market data, and it's worth reading before you assume today's borrowing costs are permanent.
What the Formula Leaves Out
This is a screening tool. It was never built to be the last word, and it goes quiet on several things that decide whether you actually make money.
Your loan. The math ignores debt completely. Two investors buying at the same 7% can end up in wildly different places depending on financing costs, leverage, and terms. One sees 14% cash-on-cash. The other barely breaks even.
Capital expenses. No single ratio warns you that the roof has four years left or that the sewer line is original. That lives in the inspection report.
Time. Cap rates describe one year. Real estate investing plays out over many. A building at 5.5% in a market with a 4% rent growth rate can easily beat an 8% building where future cash flows go nowhere. Market cycles matter more than most spreadsheets admit.

Cap Rate vs. Cash-on-Cash Return vs. ROI
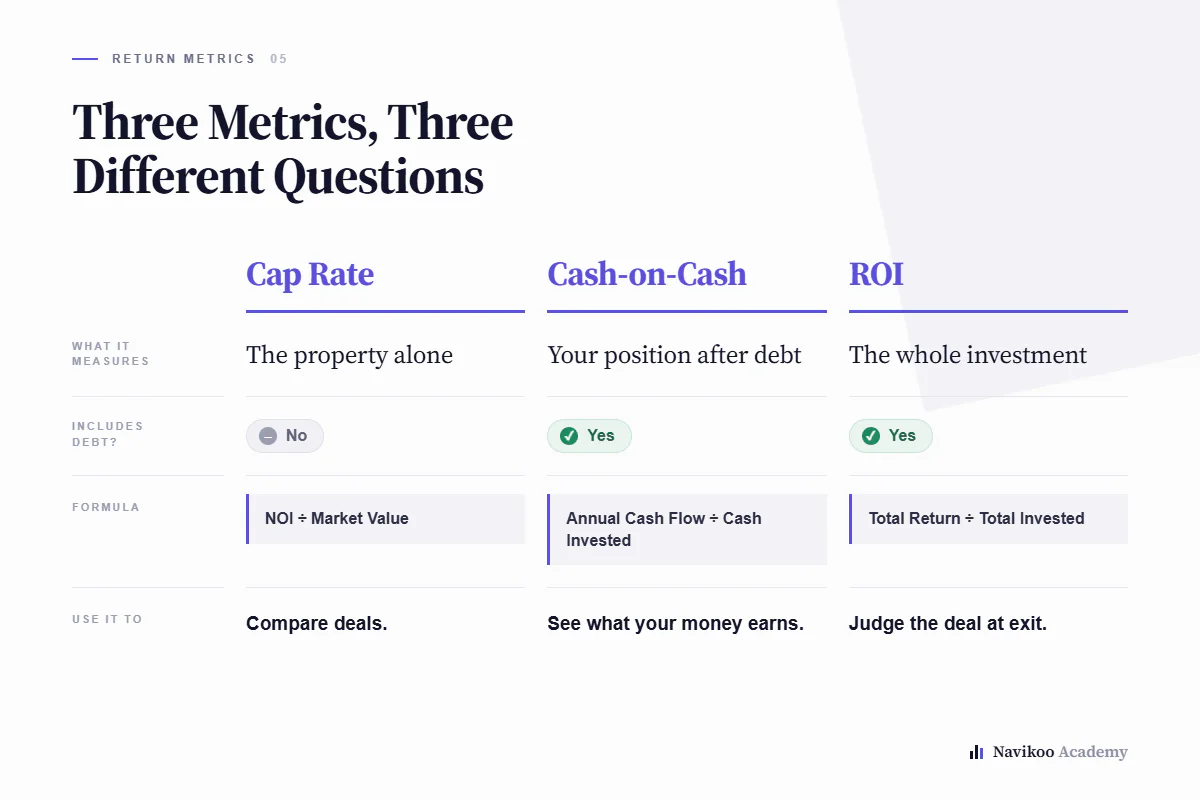
These three get mixed up constantly. Here's the difference.
Cap rate measures the property with no debt attached. Use it to compare deals against each other.
Cash-on-cash return measures your position after financing. Annual cash flow divided by the cash you actually put in. Use it to see what your money is doing.
Return on investment is the widest lens. It folds in cash flow, principal paydown, tax treatment, and appreciation across the full hold. Use it to judge the investment once you exit.
Run the cap rate first to decide whether a deal deserves your attention. Run the other two before you commit investment capital. Or run all three with the Navikoo's rental property calculator.
How Investors Actually Use Cap Rates
In practice nobody makes a real estate investment decision on this number alone. Here's where it earns its keep.
As a filter. Looking at forty listings? Cap rates knock thirty off the list in an afternoon.
As a valuation tool. Divide net operating income by the going market rate and you get an estimate of what a real estate investment property should be worth (especially when renovating unit to get a ARV).
As a scorecard. Lift rental income or trim costs, and you can see exactly what that does to value at a given capitalization rate.
As a market read. When capitalization rates in a submarket compress over two years, capital is flowing in. When they widen, it's leaving. That signal often shows up before prices do.
As a cross-category check. Comparing an apartment building to a retail strip, or real estate against another asset class entirely, starts here and then moves into the details. Real estate investment decisions age fast when rates move, so rerun the math yearly on what you own.
Five Mistakes That Wreck Your Numbers
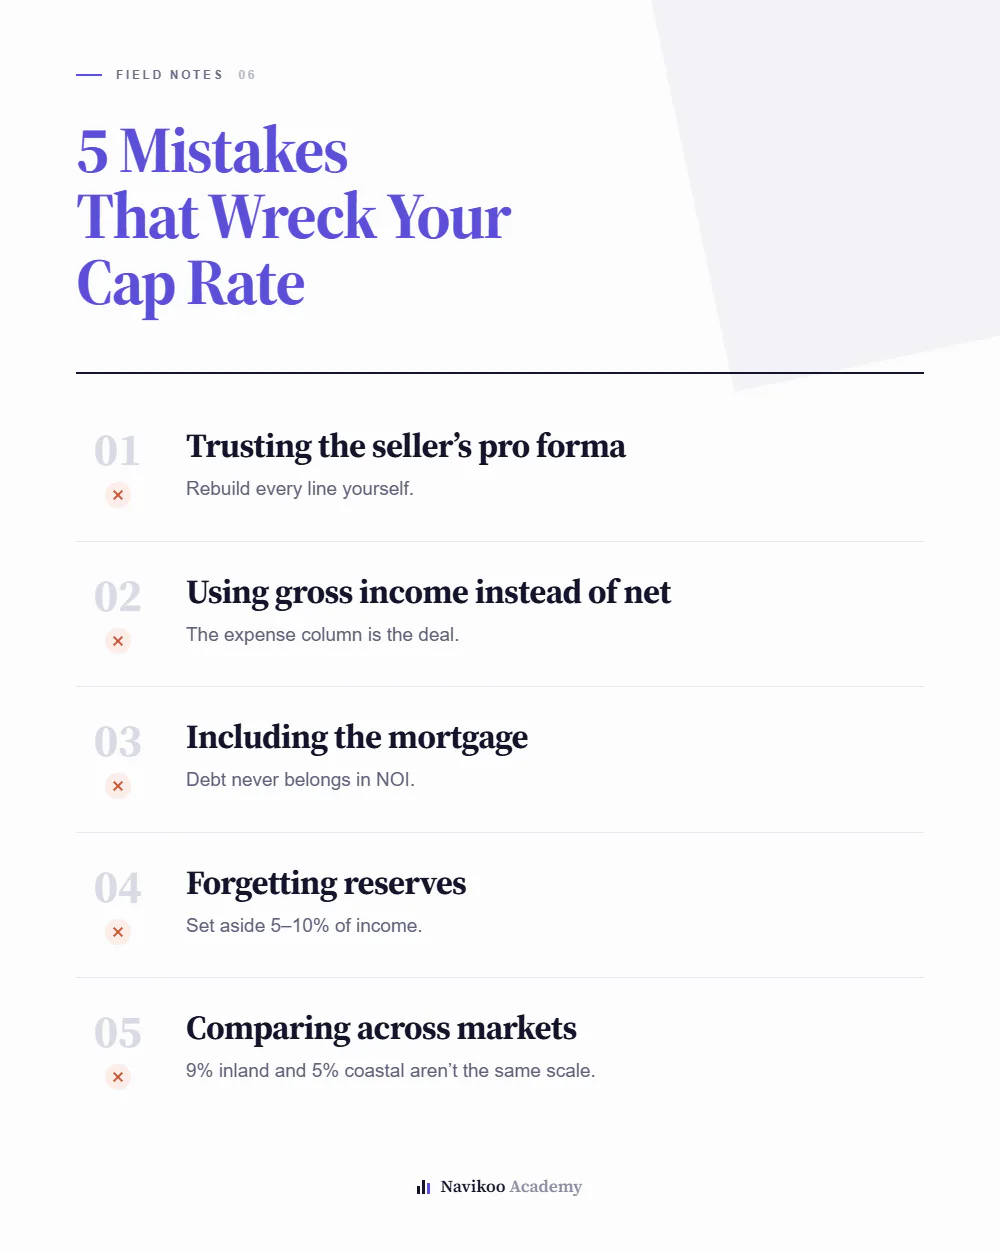
1. Trusting the seller's pro forma. Listing sheets show what the property could hit someday under perfect management. Rebuild every line with your own investment assumptions.
2. Using gross income instead of net income. Skipping the expense column doesn't make a deal look good. It makes it look imaginary. Also, keep track of rent growth trends.
3. Including the mortgage. Mortgage interest never belongs in net operating income. Put it in and you've calculated something else entirely.
4. Forgetting reserves. Roofs, water heaters, and parking lots don't bill you monthly, but they bill you. Set aside 5% to 10%.
5. Comparing across markets. A 9% capitalization rate in a rust belt town and a 5% in a coastal city aren't on the same scale. Compare within a market, within a property type.
Frequently Asked Questions
Is a higher cap rate always better?
No. A higher capitalization rate means more income relative to price, and it usually means more risk. The right target depends on your investment strategy, not on which number is bigger.
Does a cap rate calculator save time?
Yes, for the arithmetic. Any of them handles the division in a second. What decides whether your answer is any good is the expense list you feed it, and no tool builds that for you.
Can two people get different results on the same investment property?
All the time. One assumes 5% vacancy and self-management, another assumes 8% and a property manager. Same building, different NOI, different answer. Always ask what assumptions sit underneath a quoted number.
Do cap rates apply to house flips?
Not really. This measures ongoing annual income, so it's built for rental property and commercial real estate deals. A flip has no stabilized income stream to capitalize.
The Takeaway
A cap rate is one line of arithmetic that hides a lot of judgment.
Net operating income over current market value. That's the mechanics, and you'll have it memorized after three deals.
Every academy teaches the formula. What separates the investors who use it well from the ones who get burned is the discipline underneath. Verifying income instead of accepting it. Building a real expense list. Knowing what the number means in your market this quarter, not what a blog said it should be nationally.
Get that part right and cap rates become the fastest deal filter you own. Get it wrong and it's just a number that made a bad property look reasonable.
Navikoo is built for real estate investors who want to make smarter, more confident decisions. From calculating cap rate and analyzing deals to using a growing suite of investment tools, Navikoo helps you evaluate opportunities and navigate every step of your real estate investing journey.