Neighborhood Analysis in Real Estate: Reading the Block Before the Spreadsheet
Neighborhood analysis helps real estate investors translate local conditions into better underwriting assumptions. Learn how to evaluate rents, housing supply, income context, schools, safety, amenities, operating risk, and block-level differences—and see why a property with the higher gross yield can still produce the lower return.
A rental property can look attractive on paper and still underperform because the neighborhood changes the assumptions around it. Vacancy, achievable rents, maintenance, tenant turnover, future resale demand, and even the amount of management attention required can all move because of location.
Neighborhood analysis real estate investors can actually use is not a search for a “good” or “bad” label. It is a structured way to measure how a specific area affects the income, costs, risk, and exit options of an investment property.
That matters because two nearly identical family homes can produce very different results a mile apart.
One may attract potential renters quickly, renew tenants consistently, and hold pricing during a softer real estate market. The other may show a higher advertised yield but lose that advantage through vacancy, repairs, turnover, or a weaker exit price.

What Is a Neighborhood Analysis?
A neighborhood analysis is a local real estate market analysis focused on the area immediately influencing a property.
Fannie Mae's appraisal guidance treats neighborhood characteristics and trends as relevant to value and marketability and calls for an objective review of boundaries, land use, demand and supply, access, nearby services, and other value-influencing factors.
A real estate appraisal therefore looks beyond the building itself when selecting market evidence.
For investors, the questions are more operational: what can the rental property realistically earn, how quickly will it lease, how much turnover should be expected, what operating issues are common, and how liquid might the property be when it is sold?
A useful property analysis converts those observations into assumptions rather than leaving them as impressions for the property.
Start With Housing Supply, Pricing, and Rental Demand
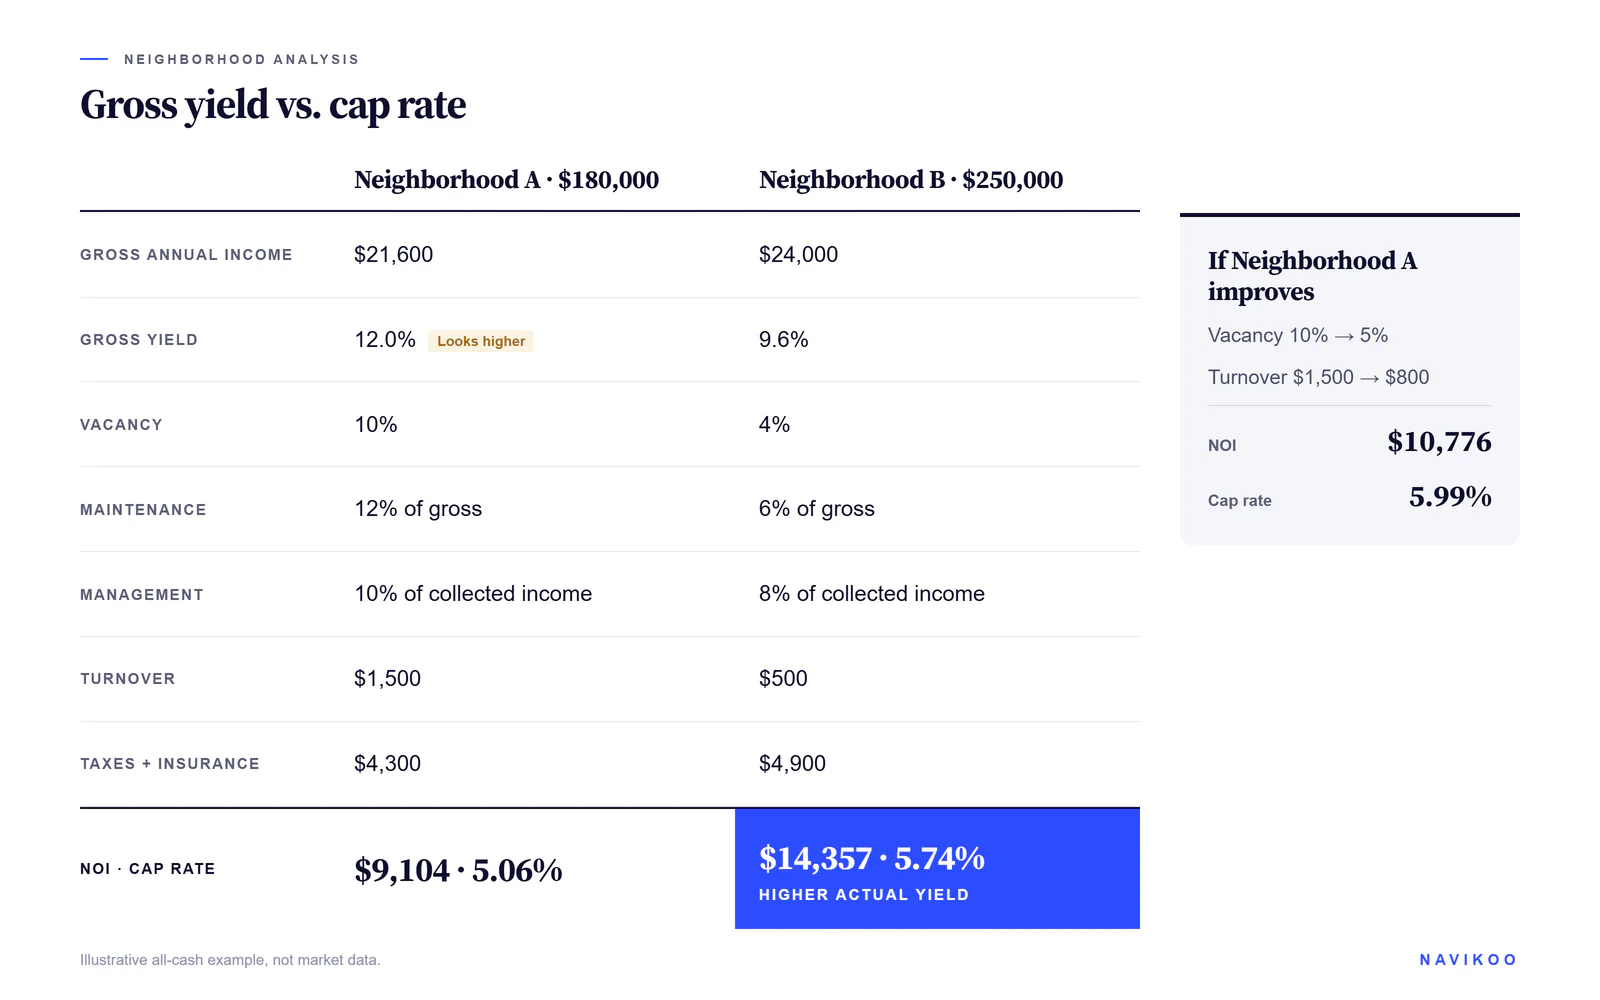
Begin with housing data, including data on home values. Compare recent sale prices, leased rents, active listings, days on market, vacancy where available, and new housing supply.
Zillow Research publishes downloadable data on home-price measures, rents, inventory, and sales at multiple geographic levels, which is useful for establishing the broader trend before drilling into specific neighborhoods and nearby areas.
Do not rely on one asking lease rate or one recent sale. Look for a multi-year direction in pricing and inventory, then compare the subject block with competing areas. A rental property surrounded by new apartment deliveries may face slower leasing even if the metro is growing. Other areas with limited new supply can support steadier demand even without dramatic price growth.
Compare the Neighborhood With Its Real Competition
ZIP codes and city averages are often too broad. The right comparison is the market area from which the property actually competes for tenants and buyers. For a small real estate investment, that may be several nearby blocks or adjoining areas, a district boundary, or a cluster around a transit corridor rather than an entire municipality.
This market analysis is also where comparable leases matter. Compare similar bedrooms, property type, condition, parking, laundry, and services. There are free Rent Estimators that can help organize comparable leases and current rental income and market asking rate, while Rental Property Calculators can show what happens when the neighborhood assumption changes from 3% vacancy to 7%, or when expected rent growth is reduced.
Use Household and Income Data as Demand Context, Not a Shortcut
The American Community Survey provides social, economic, housing, commuting, and demographic data down to census tracts. For market analysis, useful fields include household income, household size, housing tenure, employment, commuting patterns, and age profile because they can help explain what types of housing residents are using and whether an area is changing. The ACS provides profiles at the census tract level as well as broader geographies.
Those figures should describe demand, not become a proxy for who should or should not live in an area. The federal Fair Housing Act prohibits discrimination in housing based on protected characteristics including race, color, national origin, religion, sex, familial status, and disability. An investor can study market conditions while keeping advertising, leasing, and tenant-selection decisions consistent with fair housing law.
Schools: Boundaries and Trends Matter More Than a Single Rating
Schools can influence buyer demand and, in some rental markets, demand from potential tenants, but one rating is an incomplete measure. Confirm the assigned school system and boundary first, because nearby homes can feed different districts. The National Center for Education Statistics maintains public-school, district, enrollment, and geographic information, while state education agencies publish performance and accountability records.
For an investment property, watch enrollment trends, boundary changes, and whether the relevant campus is actually assigned to the address. Third-party ratings can change; a boundary can change the comparable set immediately. Owners should treat education access as one market factor among several rather than assuming it determines property values by itself.
Safety: Use Reported Evidence, Not Neighborhood Labels
Investors often ask whether an area is a safe neighborhood. A better question is what reported crime rates show over several years and how that trend compares with the surrounding city. The FBI's Crime Data Explorer publishes UCR information reported by participating law-enforcement agencies, and local departments may provide more granular incident maps or neighborhood reports.
Crime needs context. Reporting coverage, population changes, boundaries, and a small number of incidents can distort short-term comparisons. Avoid describing an area as a bad neighborhood based on anecdotes, one drive-through, or one website score. HUD clarified in 2026 that real estate professionals can provide crime and school-quality information consistently and without discriminatory intent; the stronger analytical practice is still to present objective sources rather than subjective judgments.
Amenities and Access
Daily access matters when it reduces friction in everyday life.
Grocery stores, parks, transit, medical services, universities, major employers, and walkable retail are local amenities that can support demand, but proximity to amenities should be measured in actual travel time and relevance to likely renters rather than as a generic checklist.
For workforce rentals, commute time to major employment centers may matter more than restaurants. For student housing, campus access may dominate. For family homes, schools, parks, storage, and practical retail can matter more. The same local features can therefore affect different neighborhoods differently depending on property type and renter profile.
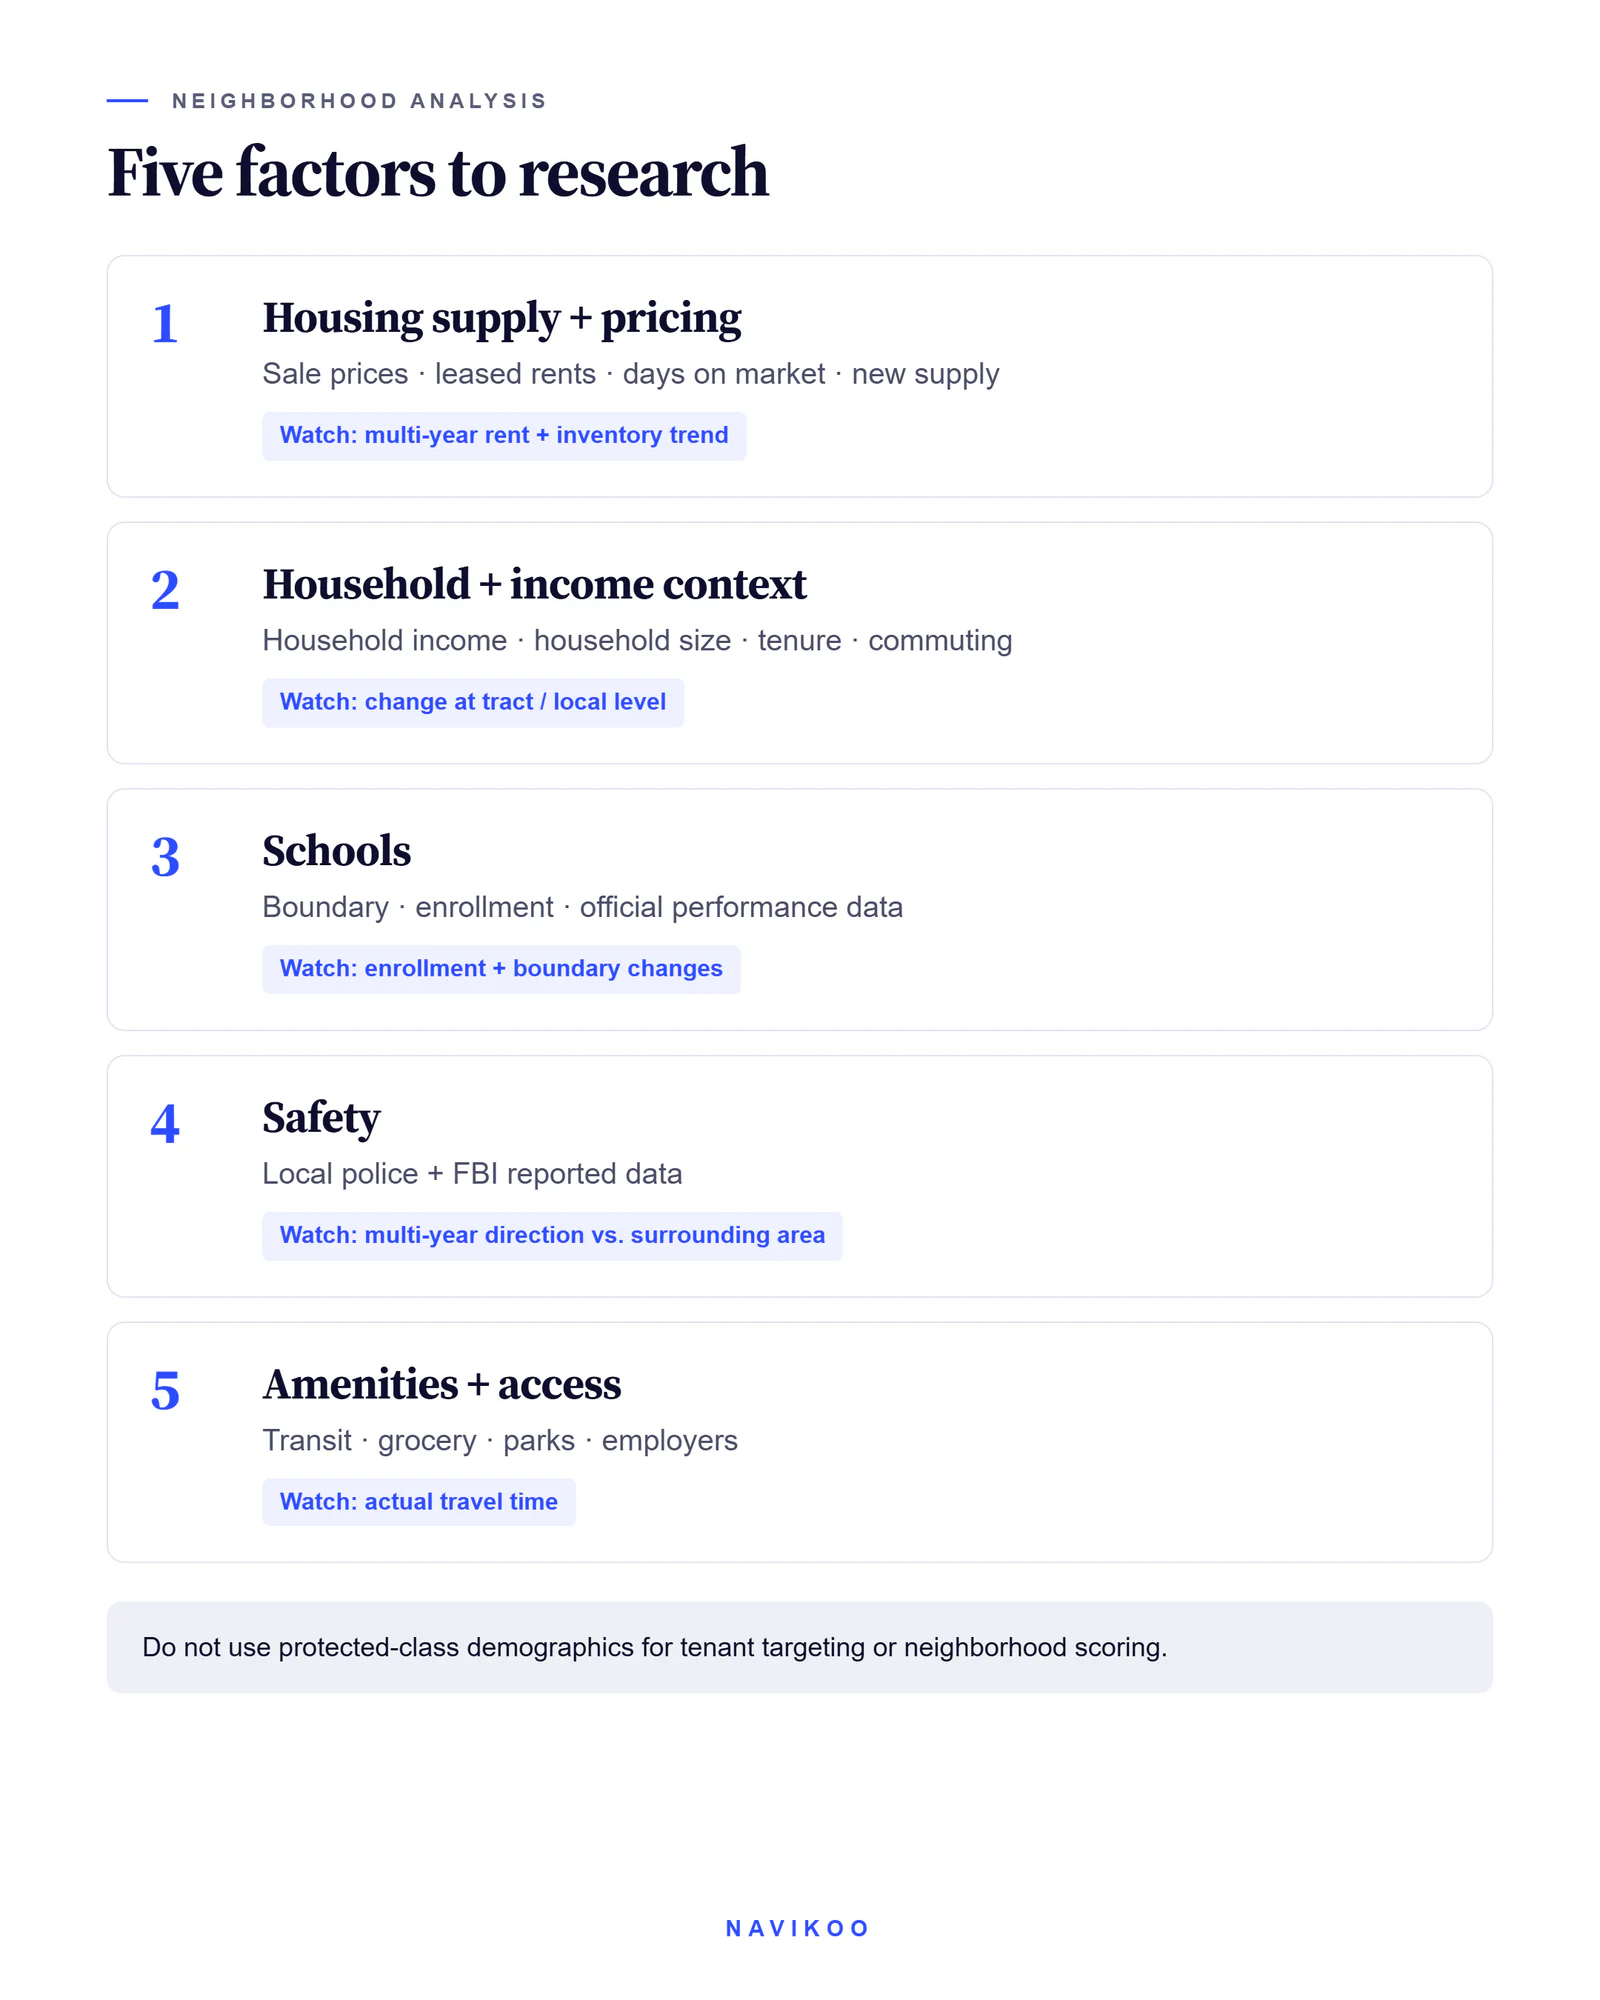
A, B, C, and D Neighborhood Classes: Useful Shorthand, Weak Underwriting
Some real estate investing communities use an informal A-to-D classification to summarize market quality or operating risk. There is no universal standard, and analysts draw the lines differently, so the classification should never replace measurable evidence.
Informal class | Typical property/market profile | Common underwriting implication |
|---|---|---|
A | Newer stock, steady demand, higher property values | Lower stated yield, usually lower operating volatility |
B | Established housing, balanced demand and condition | Middle-ground yield and management profile |
C | Older stock, more deferred maintenance or turnover | Higher stated yield, more operating and capital risk |
D | High vacancy, distress, weak liquidity or major physical issues | Highest stated yield potential, highest management and exit risk |
The useful part of the classification is not the letter. It is forcing investors to ask what measurable factors justify it: vacancy, condition, collection history, housing stock, liquidity, redevelopment, maintenance burden, and demand. Neighborhood ratings that compress all of those factors into one score can hide the reason a property is cheap.
The Block Can Be Different From the ZIP Code
Neighborhood boundaries are rarely perfect. A railroad, highway, district boundary, commercial corridor, floodplain, major construction project, or even a few blocks of different housing stock can separate two micro-markets that share the same ZIP code.
Walk or drive the immediate area during more than one part of the day. Look at property condition, vacant lots, active construction, traffic, parking, land use, and whether nearby properties are being maintained. Even a back lawn, alley, common area, or boarded opening can reveal maintenance patterns that a listing photo misses. Talk to a property management company or property leasing agent who works nearby and ask about turnover, collections, leasing time, and common repair calls. Local residents can add context, but their observations should be treated as anecdotal until supported by records.
Why a Higher Yield Can Mean a Worse Investment
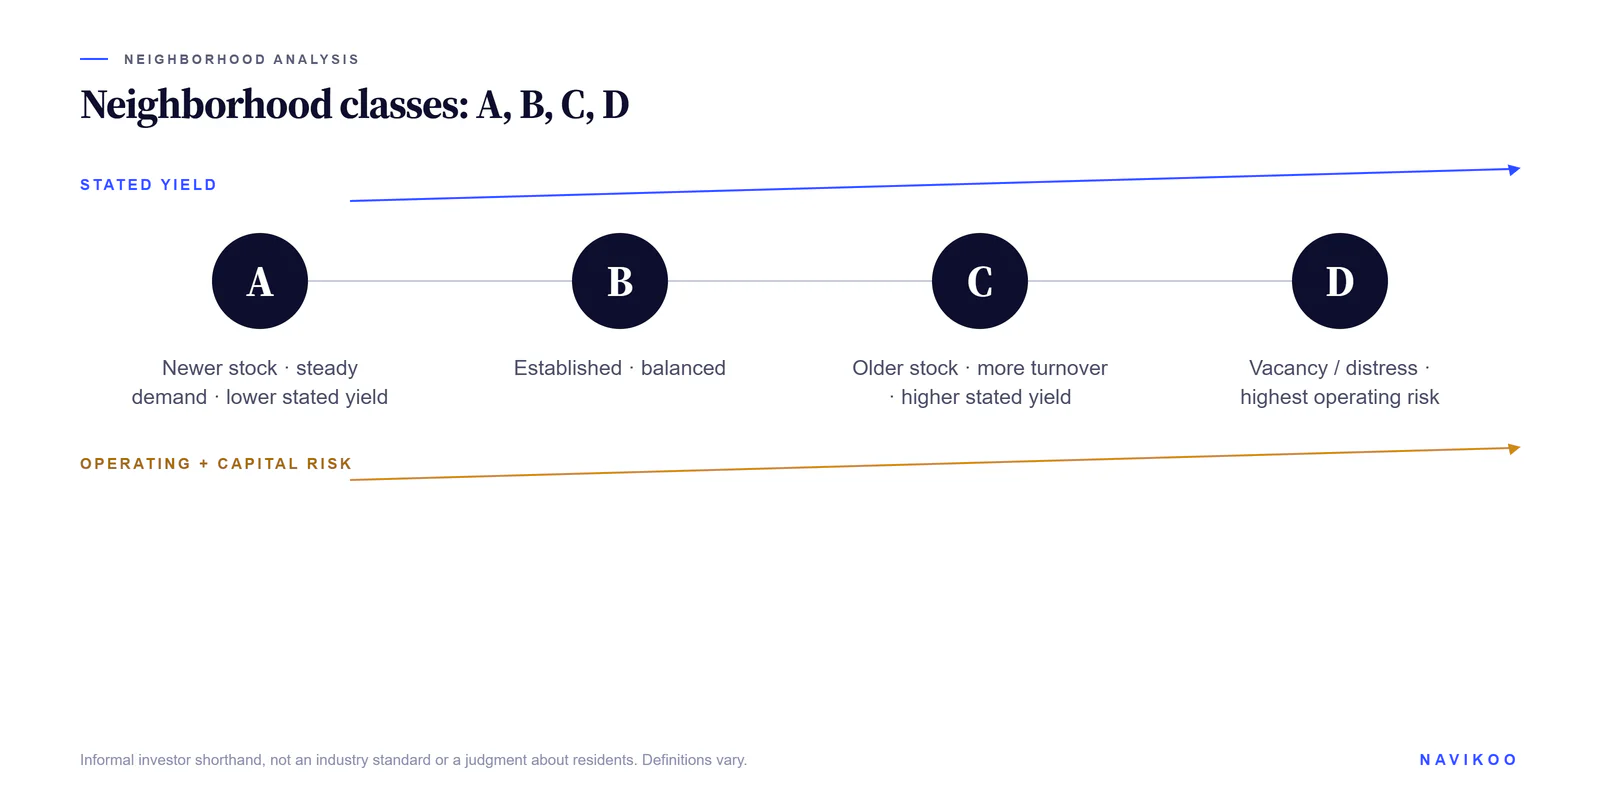
Consider two hypothetical all-cash rental properties. Neighborhood A has a lower purchase price and higher gross yield, while Neighborhood B is more expensive and initially looks less attractive.
Item | Neighborhood A | Neighborhood B |
|---|---|---|
Purchase price | $180,000 | $250,000 |
Gross annual rental income | $21,600 | $24,000 |
Gross yield | 12.0% | 9.6% |
10% | 4% | |
Maintenance | 12% of gross income | 6% of gross income |
Property management | 10% of collected income | 8% of collected income |
Turnover allowance | $1,500 | $500 |
Taxes + insurance | $4,300 | $4,900 |
$9,104 | $14,357 | |
5.06% | 5.74% |
Neighborhood A looks better on gross yield. After vacancy, maintenance, management, turnover, taxes, and insurance, Neighborhood B produces the higher cap rate and cash return. The cheaper property was not actually the higher-return investment.
Now improve only two conditions in Neighborhood A: vacancy falls from 10% to 5%, and turnover drops from $1,500 to $800. NOI rises to $10,776 and cap rate to 5.99%. Nothing about the structure changed. The improvement came from the operating assumptions attached to the area.
That is why location analysis belongs inside real estate underwriting instead of beside it. Vacancy, maintenance, turnover, expected income, and exit values should change when the evidence changes.
How to Check if a Neighborhood Is Good or Bad
Do not begin with a label. Build a short scorecard using evidence that can be checked again later: lease trend, vacancy or leasing time, sale-price trend, housing supply, job access, district boundary, reported safety trend, condition of nearby housing, permits, and planned construction.
Then ask whether those factors support the specific investment decisions you are considering. A C-classified area with stable collections and improving vacancy may be a better rental property than an A-classified area priced for perfection. An area with strong resale demand may be better for a fix-and-flip than for a high-yield rental. The answer depends on strategy and financing.
How Neighborhood Analysis Changes Rental Underwriting
Translate every observation into a financial input. Weak renter demand becomes higher vacancy or slower lease growth. Older housing stock becomes a larger maintenance and capital-reserve assumption. Frequent turnover becomes leasing, cleaning, and make-ready cost. Better liquidity becomes a more defensible exit price, not an automatic appreciation assumption.
This is where neighborhood analysis connects to the rest of real estate research. Job Growth and Population Growth help explain demand; Absorption Rate shows how quickly inventory is clearing; Fair Market Value helps test the exit; and comparable leases show what tenants are actually paying. These factors should meet inside the same investment property model rather than live in separate browser tabs.
Using Navikoo Scout With the Property Numbers
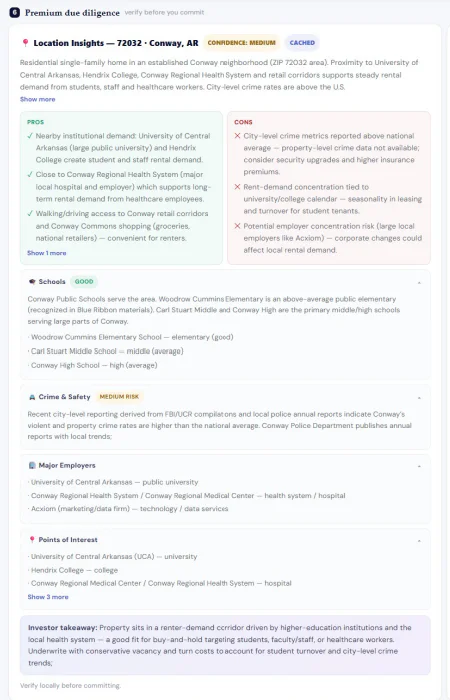
Navikoo Scout (in the Rental Calculator) can add neighborhood pros, cons, and local context to a rental deal analysis, while the calculator keeps the financial assumptions visible. The useful workflow is to use Scout to identify questions, verify important claims with primary sources, and then change vacancy, pricing, maintenance, or exit assumptions when the evidence justifies it.
That separation matters. A neighborhood feature is not valuable because a summary says it is positive or negative. The rent assumption still has to be supported by comparable leases. It matters only when it changes tenant demand, operating cost, financing, or what another buyer is likely to pay for the real estate property.
Before You Commit to an Area
For a first pass, compare areas on the same five groups: housing supply and pricing, demand and income, education access, safety, and amenities/access. Then revisit the block in person and verify the assumptions with local sources.
For the final underwriting, remove the adjectives. Do not write “safe,” “up-and-coming,” or “bad.” Write what the evidence says: vacancy fell, lease rates improved, permits increased, a district boundary changed, reported incidents trended down, a major employer is twenty minutes away, or new supply is scheduled nearby. That makes the neighborhood analysis easier to defend, easier to update, and more useful than a neighborhood score.