Vacancy Rate: How to Derive the Number Instead of Guessing It
Learn how to calculate rental vacancy rate using unit-days, turnover, and re-leasing time instead of guessing. See formulas, examples, and how vacancy affects NOI and property value.

Most underwriting uses 5% for vacancy. It appears in pro formas, lender templates, and spreadsheets across real estate investing, and it is almost never calculated.
A vacancy rate measures the share of a rental property's capacity that produced no income. Stated as a percentage, it reduces gross potential rent down to what the property realistically collects, and it is one of only three or four assumptions that materially move a valuation. The useful version of this number is not copied from a market report. It is derived from two things you can estimate for a specific building: how long tenants stay, and how long a unit sits empty between them.
What Is Vacancy Rate in Real Estate?
It is the portion of available rental time that generated nothing. A property with ten units, one of which sat empty all year, ran a 10% vacancy rate. Income arrived from nine.
Vacancy Rate Formula
Vacancy Rate = Vacant Units ÷ Total Units × 100
That version works for a point-in-time snapshot. For a period, a more accurate formula measures time rather than doors:
Vacancy Rate = Vacant Unit-Days ÷ Total Unit-Days × 100
The second formula is what an investor should use, because a unit empty for six weeks and a unit empty for the whole year are not the same event, and the first treats them identically on any given day.
Vacancy Rate vs Occupancy Rate
They are complements. An occupancy rate of 93% means a 7% vacancy rate, and nothing is gained by tracking both. Occupancy rate figures tend to appear in marketing materials because they sound better, while the vacancy rate appears in underwriting because it is what subtracts from income.
How Do You Calculate the Vacancy Rate?
Counting unit-days is straightforward once the rent roll and lease history are in front of you, and it is the calculation every investor in real estate should run before accepting a seller's vacancy rate.
A Vacancy Rate Calculation Example
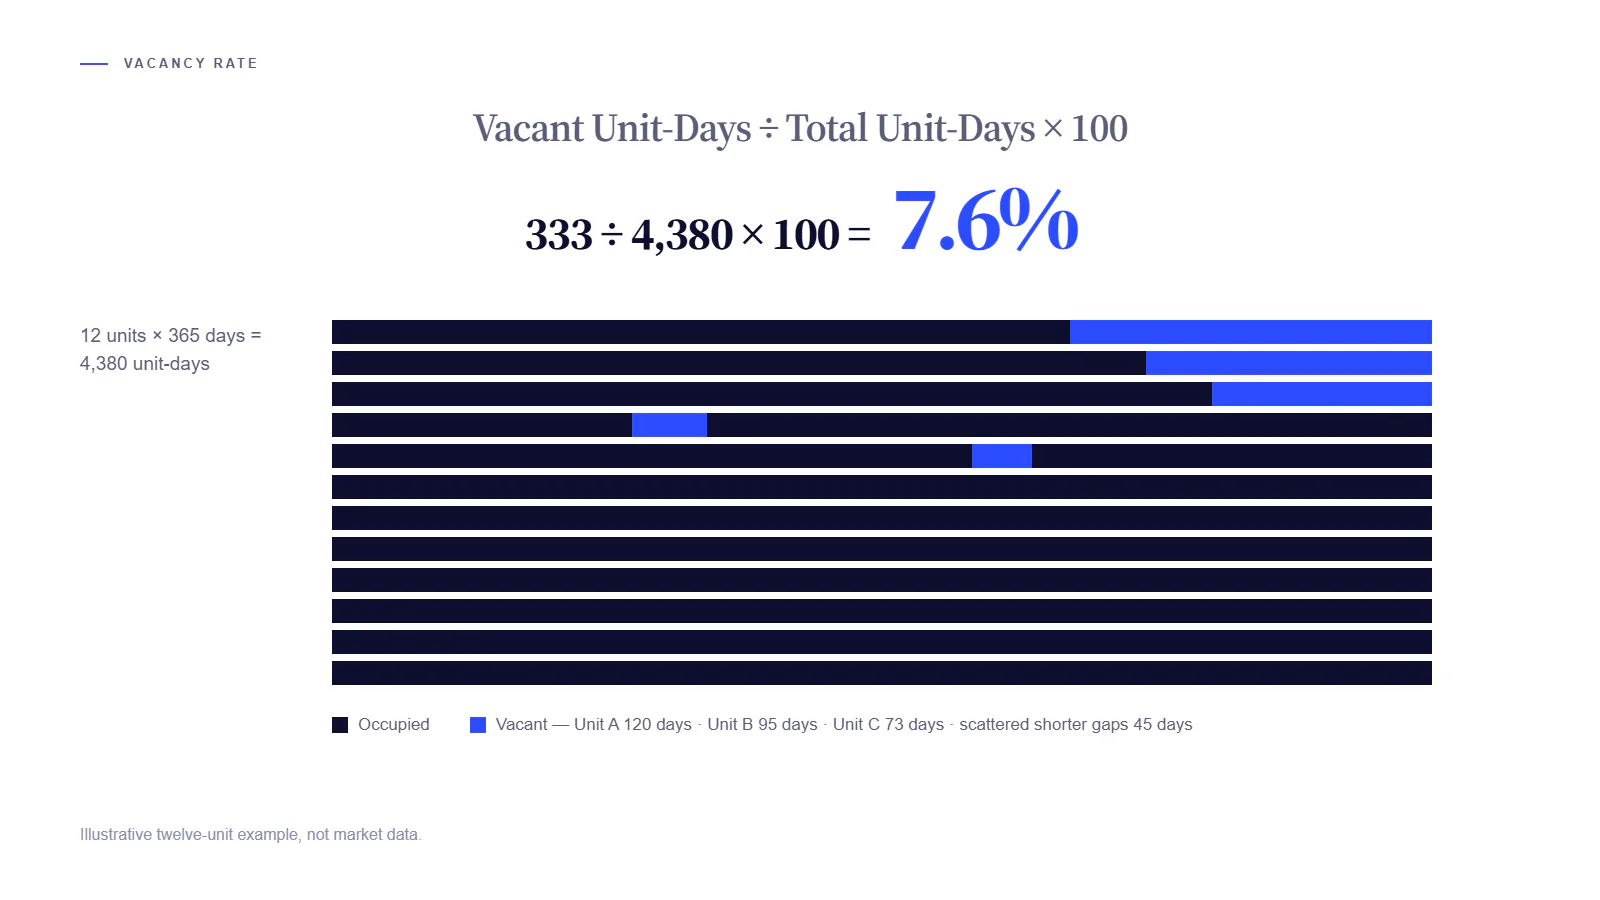
Take a twelve-unit rental property across a full year. The total number of unit-days available is the number of units multiplied by 365, giving a total number of 4,380.
Suppose the building recorded 333 vacant unit-days: one unit empty for 120 days, another for 95, a third for 73, and scattered shorter gaps totalling 45. Dividing 333 by 4,380 gives a vacancy rate of 7.6%. That is a measured figure rather than an assumed one, and it describes what actually happened rather than what a template suggested.
Because vacancy reduces effective gross income, it flows directly into net operating income (NOI) and therefore into income-based valuation.
Physical Vacancy Is Only One of Four Leaks
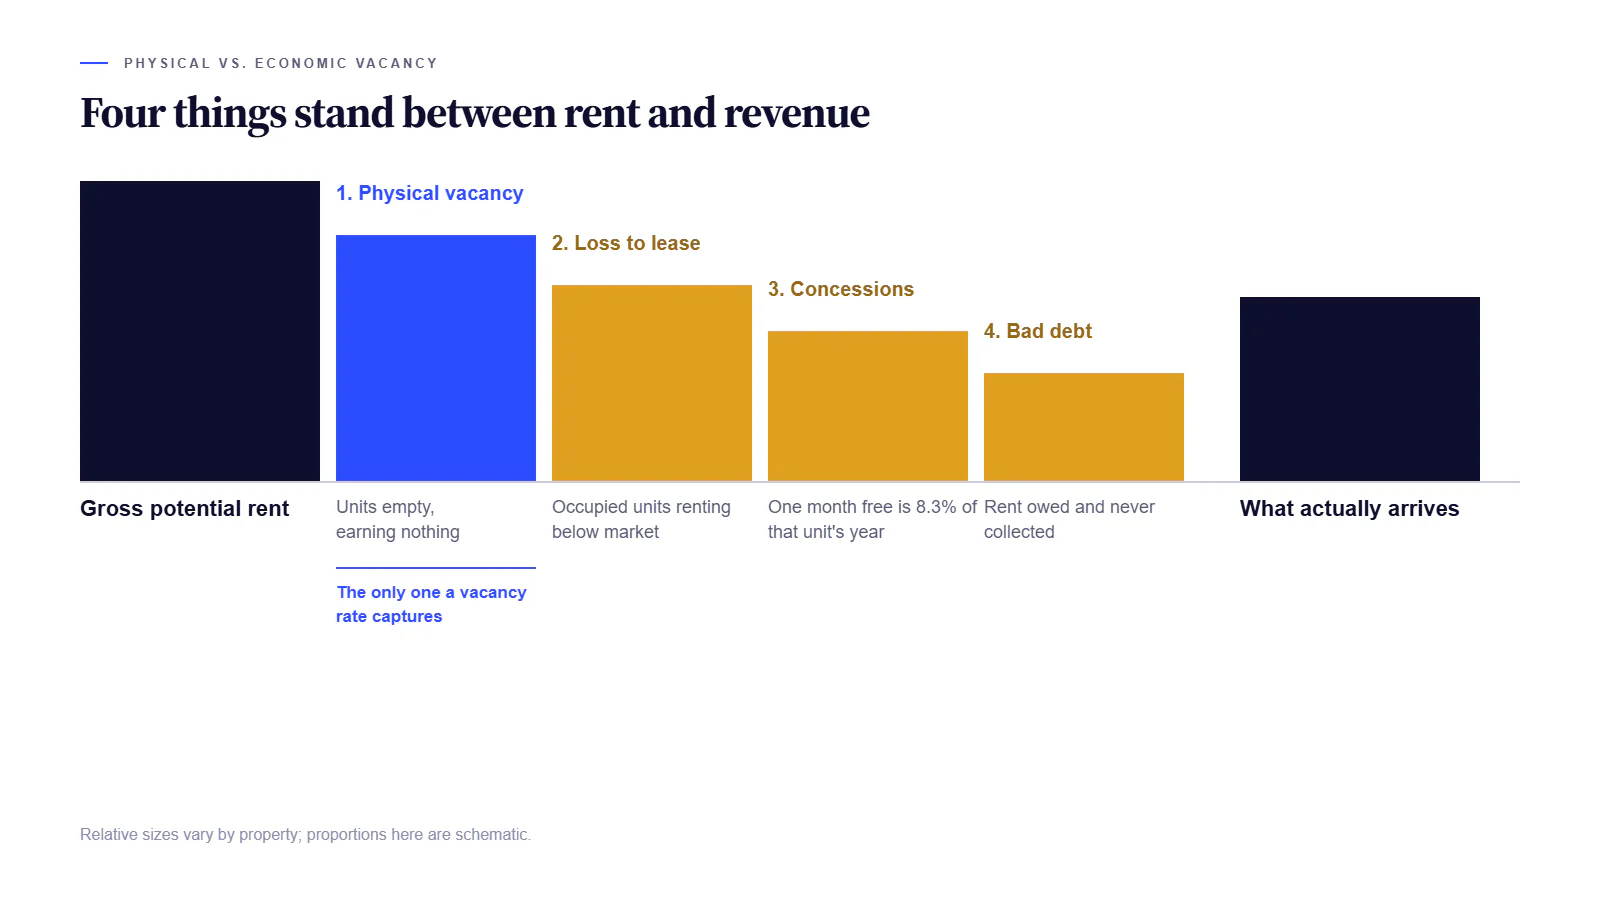
The calculation above captures empty units. It does not capture three other things that reduce collections just as effectively, and underwriting that stops at physical vacancy under-reserves.
Loss to Lease
Occupied units renting below current market rates. The unit is full, the tenant pays on time, and the property still collects less than its capacity. Nothing in a vacancy calculation registers this but you must account it.
Concessions
A month free on a twelve-month lease is 8.3% of that unit's annual rental income, and it appears nowhere in a physical vacancy count. In a soft leasing environment, concessions can exceed physical vacancy as a drag on collections.
Bad Debt
Rent owed and never collected. A tenant three months behind who eventually leaves costs the property more than a unit that simply sat empty, because the empty unit could have been re-let. Landlords who apply a 5% vacancy factor and no separate credit loss allowance have reserved for one of four problems, which is a common gap in real estate underwriting.
Physical Vacancy vs Economic Vacancy
Physical vacancy measures how much rentable time a unit sits empty.
Economic vacancy is broader. It measures the income the property fails to collect relative to its potential, which can include physical vacancy, concessions, bad debt, and loss to lease.
Two buildings can show the same physical occupancy but very different economic performance. One may have full-paying tenants at market rent, while the other relies on concessions, carries delinquency, or has several units leased below market.
For underwriting, physical vacancy is useful because it measures turnover and downtime. Economic vacancy is useful because it shows how much revenue capacity is actually being lost.
Investors should avoid combining every income leak into a single unexplained “vacancy” percentage. Separating physical vacancy, concessions, bad debt, and loss to lease makes the underwriting easier to verify and stress-test.
How to Estimate Vacancy Rate From Tenant Turnover
Here is the approach that replaces guessing. Physical vacancy is largely a function of two inputs, both of which can be estimated for a specific property.
The Two Inputs
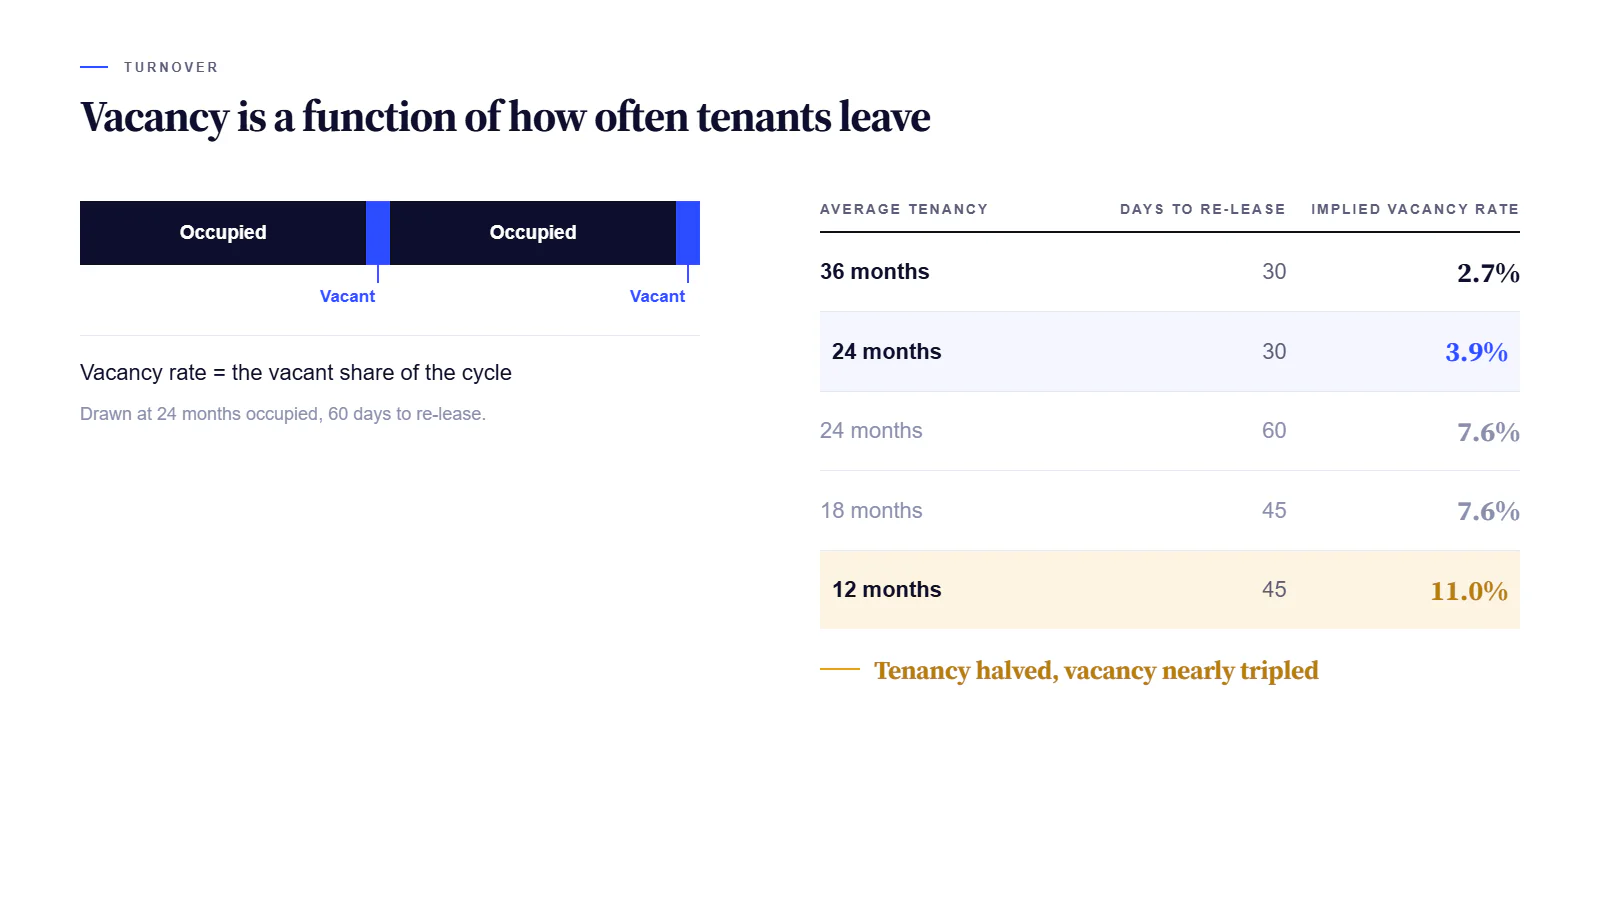
Average tenancy length tells you how often a unit turns. Average days to re-lease tells you how long the gap runs. Together they define a repeating cycle: occupied for a stretch, empty for a stretch, repeat. The vacancy rate is simply the empty portion of that cycle, and annual turnovers are what drive it.
Average tenancy | Days to re-lease | Implied vacancy rate |
|---|---|---|
36 months | 30 | 2.7% |
24 months | 30 | 3.9% |
24 months | 60 | 7.6% |
18 months | 45 | 7.6% |
12 months | 45 | 11.0% |
What the Table Shows
Two things worth sitting with. Homes where tenants stay three years and units re-let in a month run under a 3% vacancy rate structurally, and applying a 5% assumption to it understates the income. The default cuts both ways.
More importantly, tenancy length matters more than most property investors assume. Halving average tenancy from 24 months to 12 nearly triples the vacancy rate even with faster re-leasing. Retention is a vacancy strategy in real estate investing rather than a customer service one, and the cost of a renewal concession is almost always lower than the cost of the turnover it prevents.
How Vacancy Rate Affects NOI and Property Value
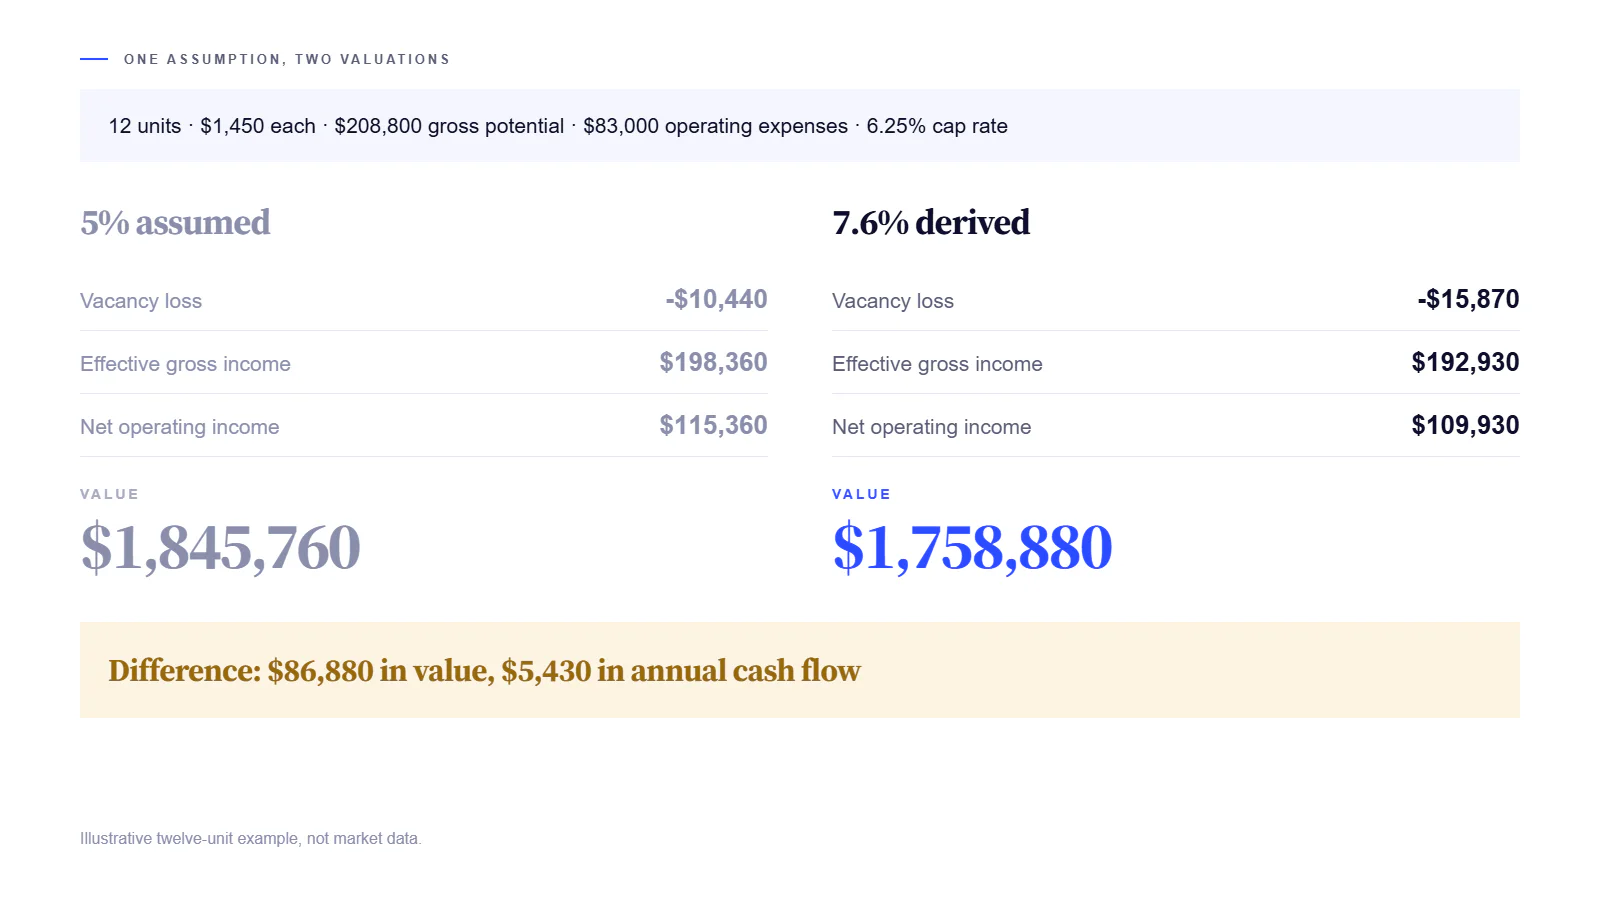
Apply both figures to the same twelve-unit property. Gross potential rent at $1,450 per unit is $208,800 a year, and operating expenses including property taxes run $83,000. These are illustrative teaching assumptions rather than market data.
5% assumed | 7.6% derived | |
|---|---|---|
Gross potential rent | $208,800 | $208,800 |
Vacancy loss | −$10,440 | −$15,870 |
Effective gross income | $198,360 | $192,930 |
Operating expenses | −$83,000 | −$83,000 |
Net operating income | $115,360 | $109,930 |
Value at a 6.25% cap rate | $1,845,760 | $1,758,880 |
A 2.6 percentage point difference in one assumption moves the valuation by $86,880 and takes $5,430 of annual cash flow with it. Nothing about the building changed. The only thing that changed was whether the investor derived the number or inherited it, which is the argument for spending an hour on tenancy history rather than typing 5% and moving on.
Lower NOI can also weaken the property's debt service coverage ratio (DSCR) and reduce the amount of debt the property can support.
What Is Considered a Good Vacancy Rate?
Lower is better only up to a point, and context decides everything. A vacancy rate near zero usually means rents sit below what the market would pay, since a property with a waiting list and no turnover is leaving income on the table. That is why operators watch vacancy and rental prices together rather than optimizing either alone.
A vacancy rate in the low single digits generally indicates a tight rental market or strong management. High vacancy rates in the low teens suggest something structural: a submarket with weak demand, a building with condition problems, or pricing above what the area supports.
How to Use Market Vacancy Data Without Misunderwriting the Property
For orientation, YCharts tracks the United States rental vacancy rate, which has recently sat near 7%(Q3-26). The Census Bureau publishes the underlying quarterly series in its Housing Vacancies and Homeownership data, which breaks the housing stock down by region and by state and reports homeowner vacancy rates alongside the rental figure.
Those two measures answer different questions. The first series counts rental homes available for occupancy; the homeowner series counts owned homes sitting empty and for sale. A housing market can show tight conditions across owner-occupied housing while rental units run loose, or the reverse, and conflating the two produces bad conclusions about either. Anyone using this housing data to support an investment decision should read which series they are looking at.
Treat national figures as context rather than as a benchmark. A national rate blends every state, every submarket, and every property type into one number, and two neighborhoods in the same city routinely diverge more than two regions do. Economic indicators such as local employment, housing starts, and household formation explain more about a specific submarket than any national series will, and the figure that matters for a real estate investment is the one your building produces.
Vacancy in Single-Family Homes
Single-family rental homes behave differently from apartments. Tenancies run longer, since households renting houses move less often, which pushes the structural vacancy rate down. The concentration, though, is total: one house with one tenant is either fully occupied or fully vacant, with nothing in between.
For landlords holding a handful of scattered homes across a real estate portfolio, that binary character makes averaging misleading. A four-home portfolio showing 7.6% vacancy did not run four homes slightly empty; it ran one home empty for four months. Rental rates in the area, rental sales activity nearby, and the condition of surrounding homes all move that outcome, which is why a property investment of this type deserves real estate underwriting one house at a time.
What Is the 2% Rule for Rentals?
This question arrives alongside vacancy constantly, and the two are unrelated. The 2% rule holds that monthly rent should reach at least 2% of the purchase price. It is a pricing screen for whether an investment property is cheap relative to its income, not a statement about occupancy. An investment property meeting the 2% test can run a 15% vacancy rate, and one at 0.6% can run none.
The rule also describes very little of the current real estate market at that threshold. Its more common 1% version still works as a first filter, and neither version tells you anything about how often units turn.
What Drives Vacancy in One Building
Real estate market conditions set the floor. Everything above that floor is specific to the property.
Unit mix matters: studios and one-bedroom homes turn more often than three-bedroom homes, because the households renting them move more often. An apartment complex weighted toward smaller rental units carries structurally higher vacancy than a comparable rental property across the street with larger floor plans, and a condo held as a single rental behaves differently again.
Condition and management come next. Deferred maintenance extends days-to-re-lease, since units show poorly and often need renovations between tenants. Slow turnover work by rental property management adds directly to the empty-day count, and every extra week is roughly 0.2 percentage points of annual vacancy on a unit turning every two years.
Pricing matters most in the short run. A unit priced 5% above what the submarket supports can sit for months, and the rent forgone while it sits usually exceeds what the higher rent would have earned across the lease. Grounding asking rents in comparable units nearby rather than in hope is the fastest lever available to any property owner, and Navikoo's rent estimator exists for exactly that check.
Property type rounds it out. Vacation rental properties and Airbnb units operate on entirely different occupancy patterns, measured in nights rather than months, and should not be underwritten against long-term benchmarks at all.
What to Verify Before Underwriting
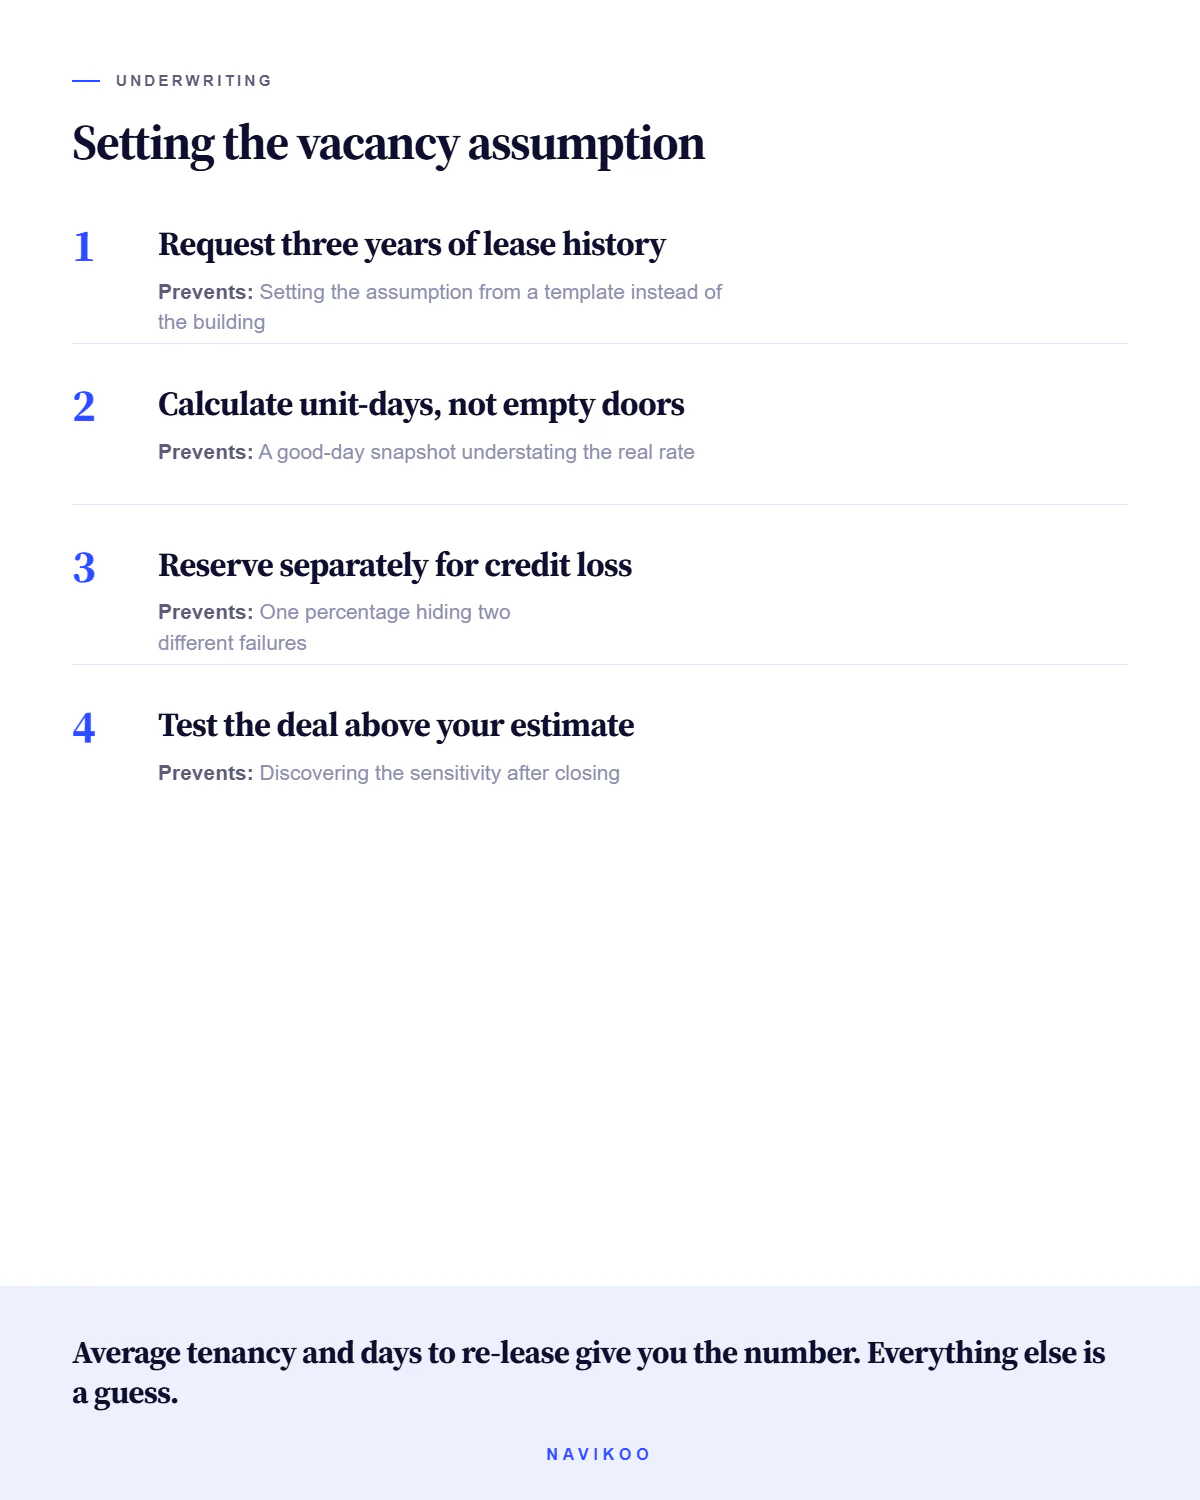
Ask for three years of lease history rather than a current rent roll. The rent roll shows today; the history shows how often units turn and how long they take to fill, which is what the vacancy assumption is actually made of. That property information is the difference between a derived vacancy rate and a borrowed one.
Calculate unit-days rather than counting empty units, since a snapshot on a good day understates the real rate and sellers tend to produce snapshots taken on good days. Reserve separately for credit loss, because vacancy and bad debt are different failures and combining them into one percentage hides both. Landlords learn this one expensively.
Then test the deal at a rate above your estimate before committing. Investors at any scale can model how vacancy, rent, and expenses interact across a full hold in Navikoo's rental calculator, which makes the sensitivity visible before it becomes a surprise. Anyone running a rental business across several buildings should track the figure per building rather than blending it, since a portfolio average conceals exactly the one that needs attention.
In real estate, the vacancy rate deserves the same scrutiny as the purchase price. On a levered deal, a two-point error in one costs more than a twenty-thousand-dollar error in the other, and only one of the two is usually negotiated.
Vacancy is only one assumption in a complete deal analysis. See our rental property analysis guide for the full underwriting process.
Explore more real estate investing guides from Navikoo.