Appreciation in Real Estate: What Drives It, What Is Normal, and What You Can Control
Real estate appreciation is the increase in property value over time. Learn what drives it, what current U.S. data shows, how leverage affects the outcome, and why investors should underwrite a property to work even if prices stay flat.

Real estate appreciation is the increase in a property's market value over time. If a house bought for $350,000 is worth $388,326 five years later, it has gained $38,326, about 2.1% a year compounded. For homeowners, that growth can build wealth quietly through homeownership and long-term home ownership. For real estate investors, it is often the largest source of profit on a long hold, and the hardest one to predict.
That unpredictability is the point most appreciation real estate guides underplay. Rent can be verified before buying; future value cannot. Real estate appreciation depends on the national economy, borrowing costs, and inflation, but even more on the local housing market and the specific property. A real estate deal that only works if values rise is a bet on future pricing, not an analysis of the asset.
The practical consequence is simple to state and easy to ignore: treat real estate appreciation as upside, not as the reason a purchase makes sense. The rest of this guide explains why, with numbers.
What Is Appreciation in Real Estate?
When a property increases in value, it appreciates. The measure is the rise in its fair market value: the price a willing buyer would pay a willing seller, both informed and under no pressure. The opposite, a fall in value, is sometimes called market depreciation, which is separate from the tax deduction of the same name.
Nominal appreciation is the increase before inflation. Real appreciation adjusts that gain for inflation: <code>(1 + nominal growth) ÷ (1 + inflation) − 1</code>. If a property rises 2.1% while inflation runs 3% over the same period, the real result is about −0.9%. Real estate is often described as an inflation hedge, but home values can lag the cost of living for long stretches.
How Does Real Estate Appreciation Work?
The Formula
The basic calculation is:
Total gain (%) = (Current value − Purchase price) ÷ Purchase price
For growth across several years, use compounding:
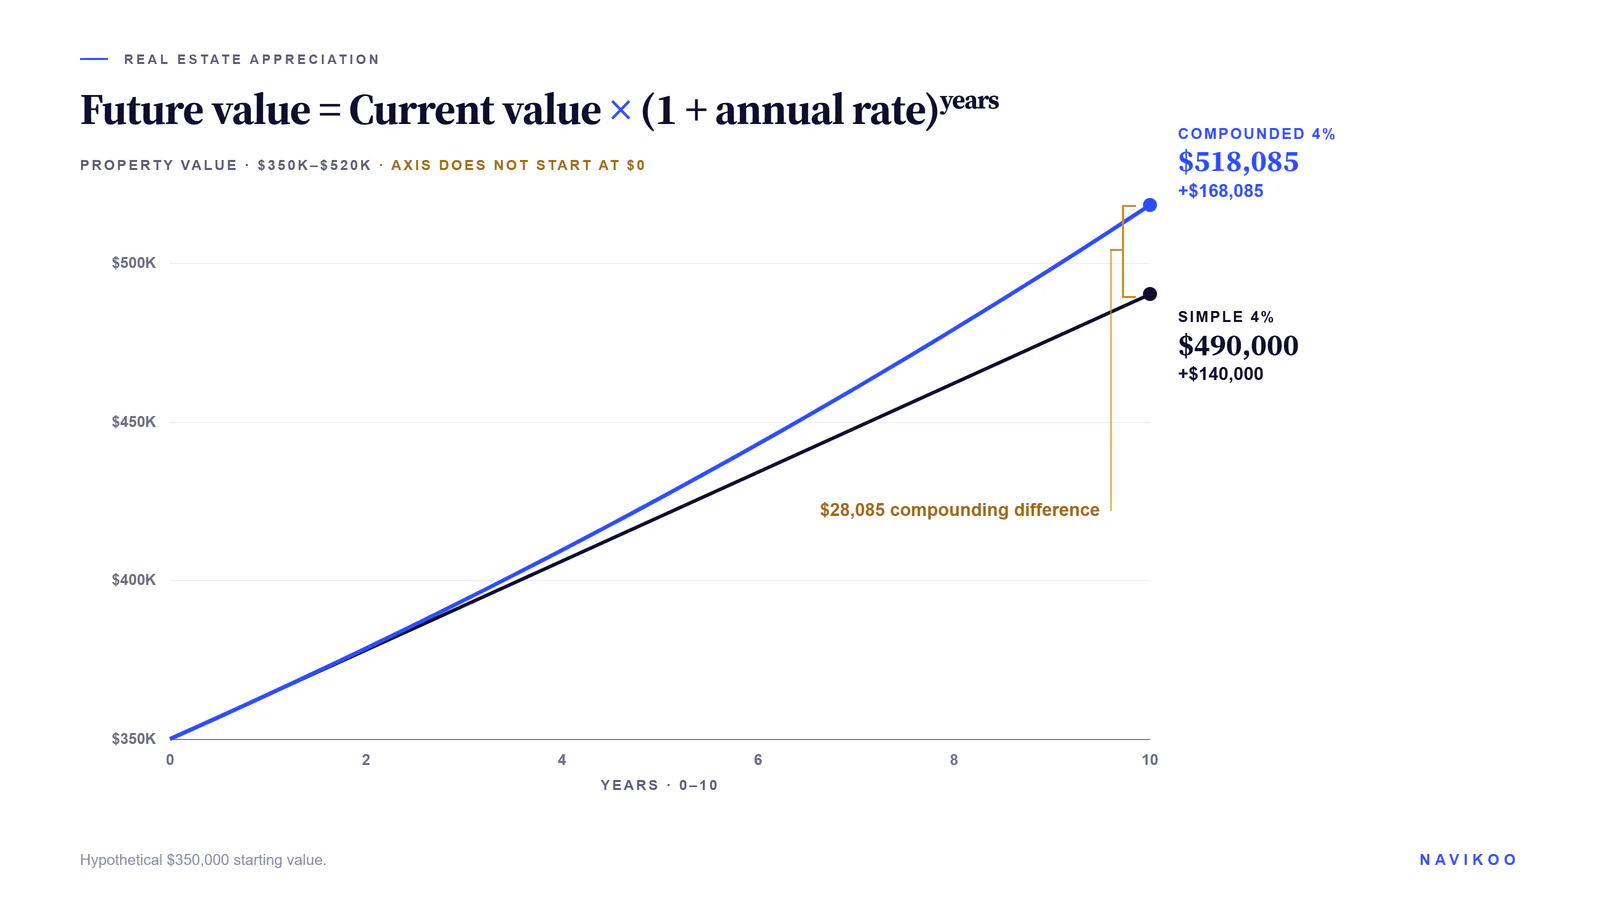
Future value = Current value × (1 + annual rate)^years
To work backward from two known prices, use:
Annual rate = (Current value ÷ Starting value)^(1 ÷ years) − 1
Why Compounding Matters
At 4% a year, a $350,000 property gains about $168,085 in ten years, not the $140,000 that simple math suggests, because each year's increase in value builds on the last. Small differences in the yearly rate compound into large differences in real estate value over a decade.
What Drives Real Estate Appreciation?
Supply and Demand
Home prices rise when demand outpaces supply. Low housing inventory, scarce land, restrictive zoning, and slow construction all support real estate appreciation. A wave of new building in a submarket can do the opposite, even when buyer activity is healthy.
Jobs, Income, and Population
Areas adding jobs and residents can see high demand for housing. Employment growth, rising incomes, and in-migration support real estate appreciation when new supply does not expand even faster. Population growth by itself is not enough; the balance between new households and new homes matters.
Interest Rates and Financing
Borrowing costs shape affordability. When interest rates fall, the same monthly payment supports a larger home loan, which can support values; when they rise, budgets shrink. Financing conditions also influence homebuyer confidence, but inventory and demand can outweigh rates in either direction.
Inflation and Location
Inflation can raise the cost of land, labor, materials, and replacement construction, but it does not guarantee that every investment property rises at the same pace. Location adds its own layer: schools, transit, parks, and other amenities can support demand, and neighborhoods receiving new public or private investment may outpace the wider real estate market.
What Is a Normal Home Appreciation Rate?
The Current US Picture
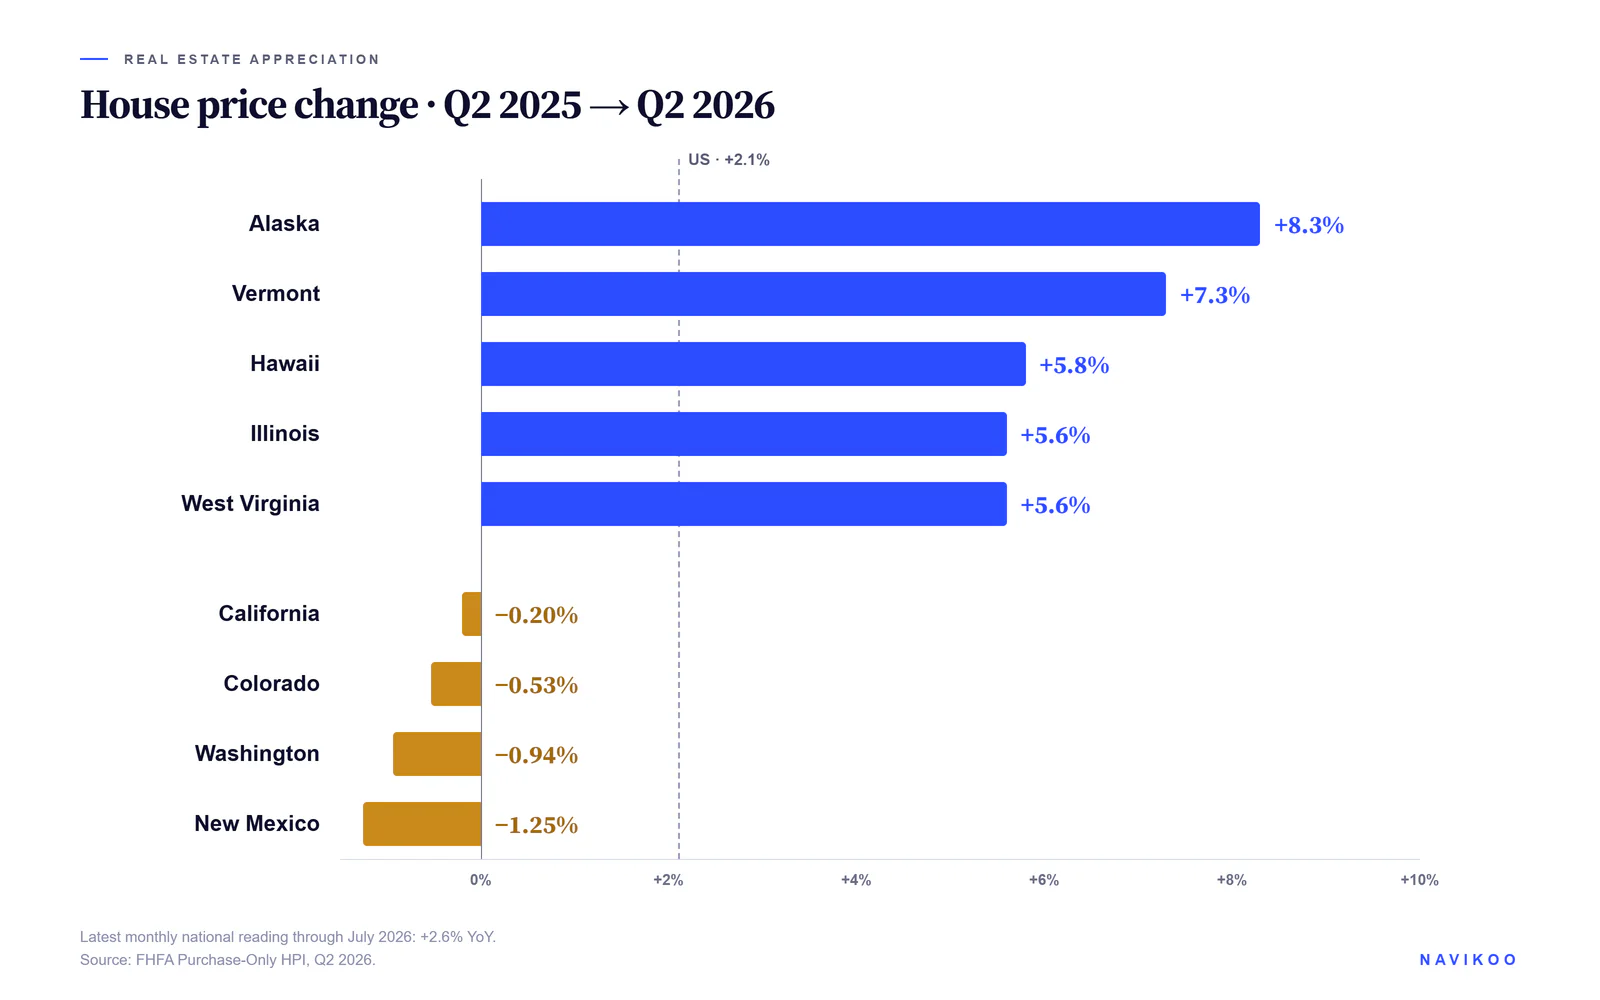
There is no single normal pace for every year or every location. The latest monthly FHFA House Price Index showed US house prices up 2.6% from July 2025 to July 2026. The latest quarterly state comparison, for Q2 2026, showed a 2.1% national rate but much wider outcomes: Alaska rose 8.3% and Vermont 7.3%, while New Mexico, Washington, Colorado, and California declined.
Why Averages Mislead
Average home appreciation figures describe a broad region, not a specific street. A nationwide figure near 2% or 3% can coexist with neighborhoods rising much faster and others falling. For any real estate investment, local data on recent sale prices matters far more than a headline.
Home appreciation also differs by property type and price tier within the same city. Entry-level homes, luxury homes, and condos can move in different directions in the same year, so the relevant comparison is always similar homes nearby.
FHFA's flagship index uses repeat sales of the same single-family properties, which helps separate actual price change from shifts in the mix of homes sold. It is useful context, but it still does not forecast one investment property.
What Is Considered a Good Real Estate Appreciation Rate?
There is no universal percentage that counts as good. One useful test is whether the increase in pricing beats inflation over the holding period, because that increases purchasing power. Growth that merely matches inflation mostly preserves real value.
For an investor, a good rate is also one the deal does not depend on. An investment property bought for cash flow can perform well with modest growth. A purchase that needs strong price growth to break even carries more risk, whatever the local forecast says. Two buyers can look at the same housing market and reasonably disagree about the outlook; the safer underwriting assumes the lower number.
How Appreciation Affects Investment Returns
A Ten-Year Example
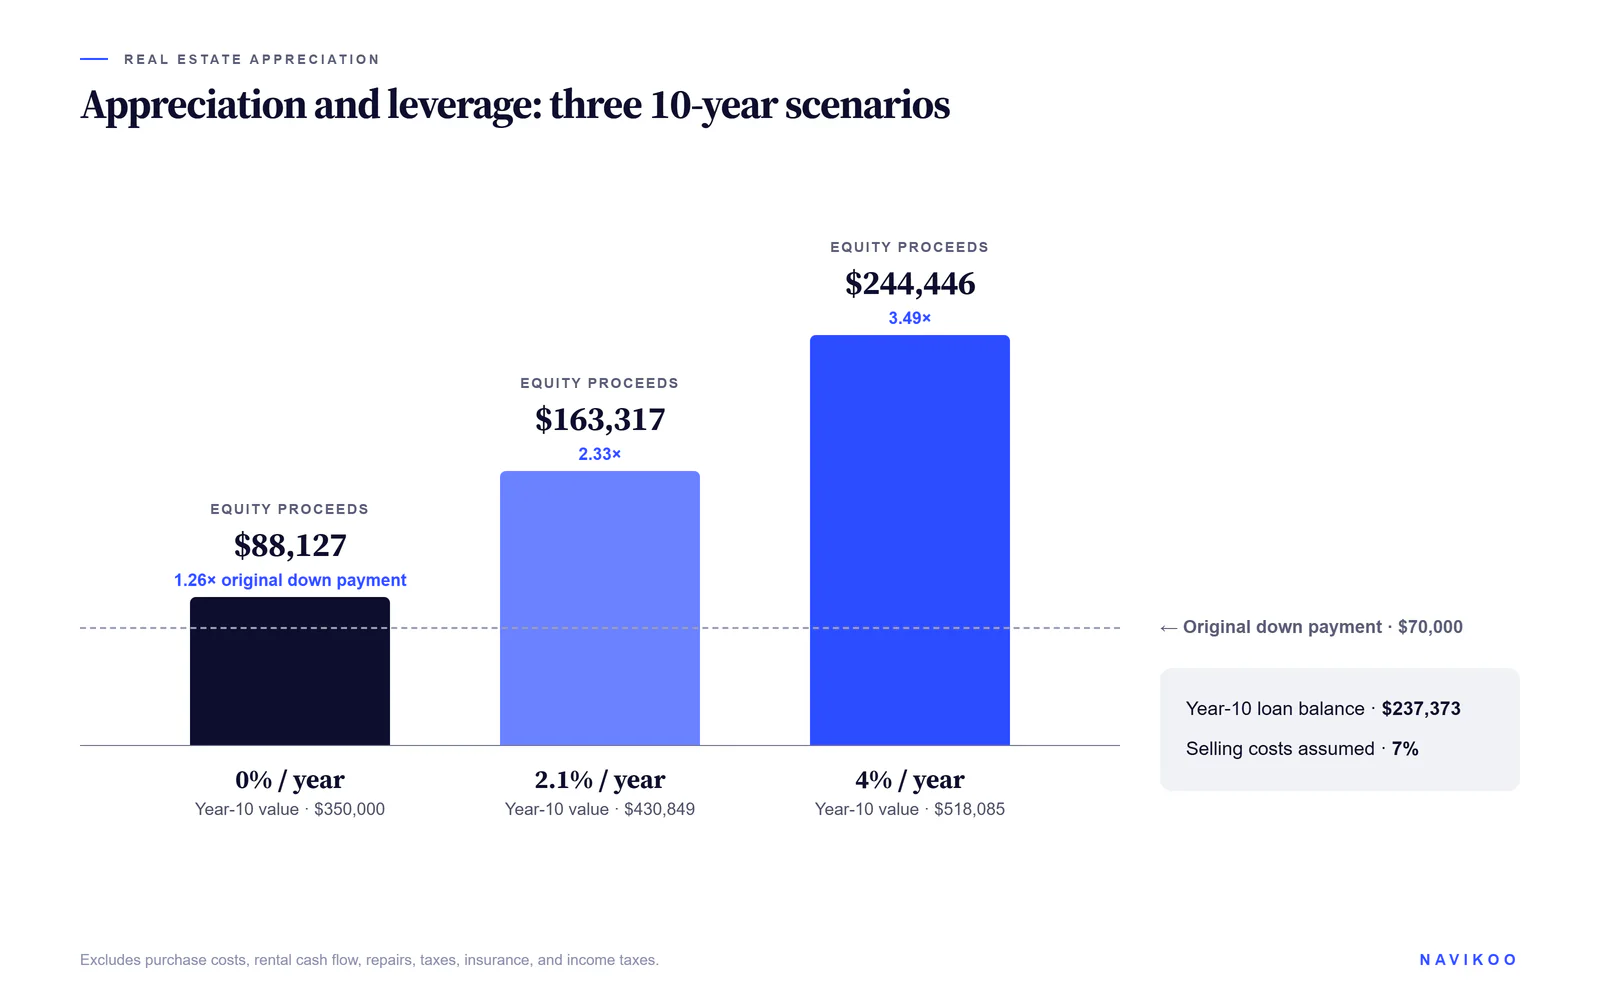
The figures below are hypothetical. A buyer purchases a $350,000 investment property with $70,000 down and a $280,000 loan at an assumed 6.5% interest rate over 30 years, with a $1,769.79 monthly mortgage payment for principal and debt service. After ten years, the loan balance is about $237,373. The table shows equity proceeds at three annual growth assumptions, after 7% selling costs.
Annual growth | Value in year 10 | Net proceeds after sale | Multiple of $70,000 down |
|---|---|---|---|
0% | $350,000 | $88,127 | 1.26x |
2.1% | $430,849 | $163,317 | 2.33x |
4% | $518,085 | $244,446 | 3.49x |
What the Table Shows
Leverage magnifies real estate appreciation because the change occurs on the full $350,000 property value, not only on the $70,000 down payment. It works in reverse too: a decline in value reduces the owner's equity first while the loan still has to be repaid.
Even at 0%, principal paydown leaves more sale proceeds than the original down payment in this simplified example, and that is the scenario a real estate investment should survive. The return should not depend on appreciation. It is not a complete return calculation because purchase costs, repairs, taxes, insurance, rental cash flow, and income taxes are excluded. Buyers can test growth, rent, and loan assumptions together in free rental property calculators.
Can You Influence Appreciation?
Market vs. Forced Appreciation
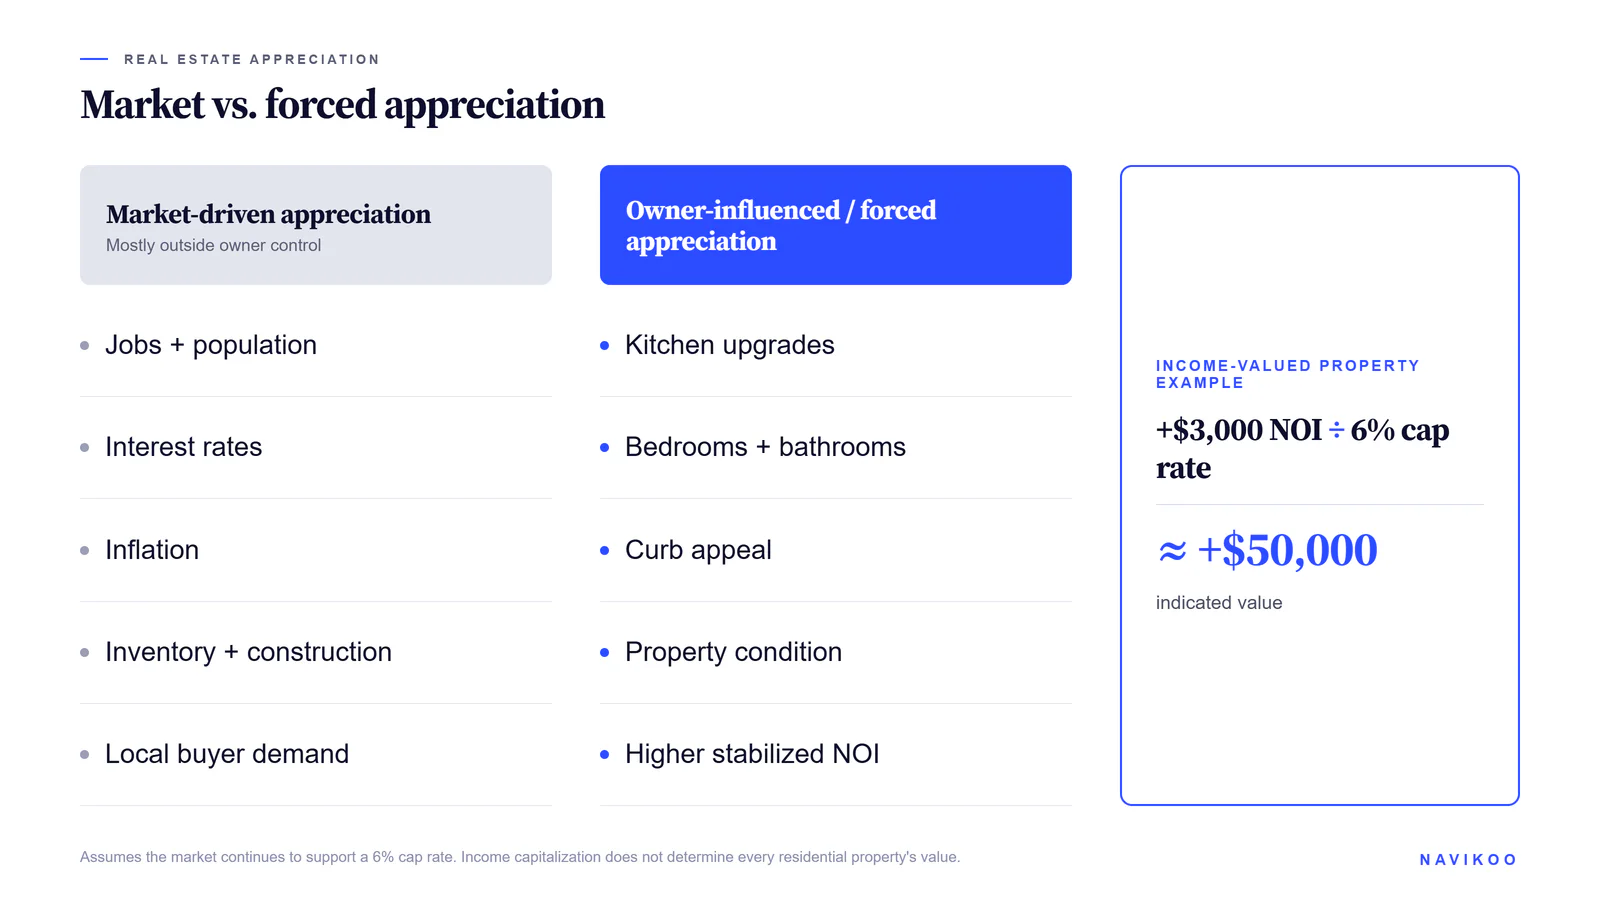
Market appreciation comes from forces outside the owner's control and does not move every property in an area by the same percentage. Forced appreciation is the increase in value an owner tries to create through improvements or better operations; the owner controls the work, but the market still decides how much value it adds.
Home Improvements That Add Value
Home improvements buyers pay for, such as kitchen upgrades, updated bathrooms, added bedrooms and bathrooms, and better curb appeal, can raise fair market value. Not every one of these renovations returns its cost, so the budget should be compared with recent sales of comparable properties with and without those upgrades.
Raising Income on Rentals
For an income-producing investment property valued mainly from income, net operating income can drive market value. At a 6% cap rate, raising stabilized NOI by $3,000 a year supports roughly $50,000 of additional value if the cap rate and other assumptions stay unchanged. Smaller residential properties may still be valued mainly from comparable sales.
Property Condition
Deferred maintenance drags real estate value down. Keeping property condition strong protects fair market value even when the market is flat.
How to Estimate Future Value
Use Local Evidence
Start with sales, days on market, and inventory in the specific neighborhood. A real estate agent can prepare a comparative market analysis, and lenders rely on an appraisal to confirm current fair market value. Appraisals and comparable sales describe the present; forecasts of future growth deserve more caution.
Model Three Scenarios
Rather than choosing one forecast, model no growth, a moderate rate, and a stronger one. If the purchase works in the low case, appreciation becomes upside. If it only works in the high case, the investment's potential profit depends on an assumption no one can verify in advance.
Keep the scenarios separate from current income. A property can create value through rent and loan paydown while prices stay flat, or show strong home appreciation while producing weak cash flow.
What Is the Hardest Month to Sell a House?
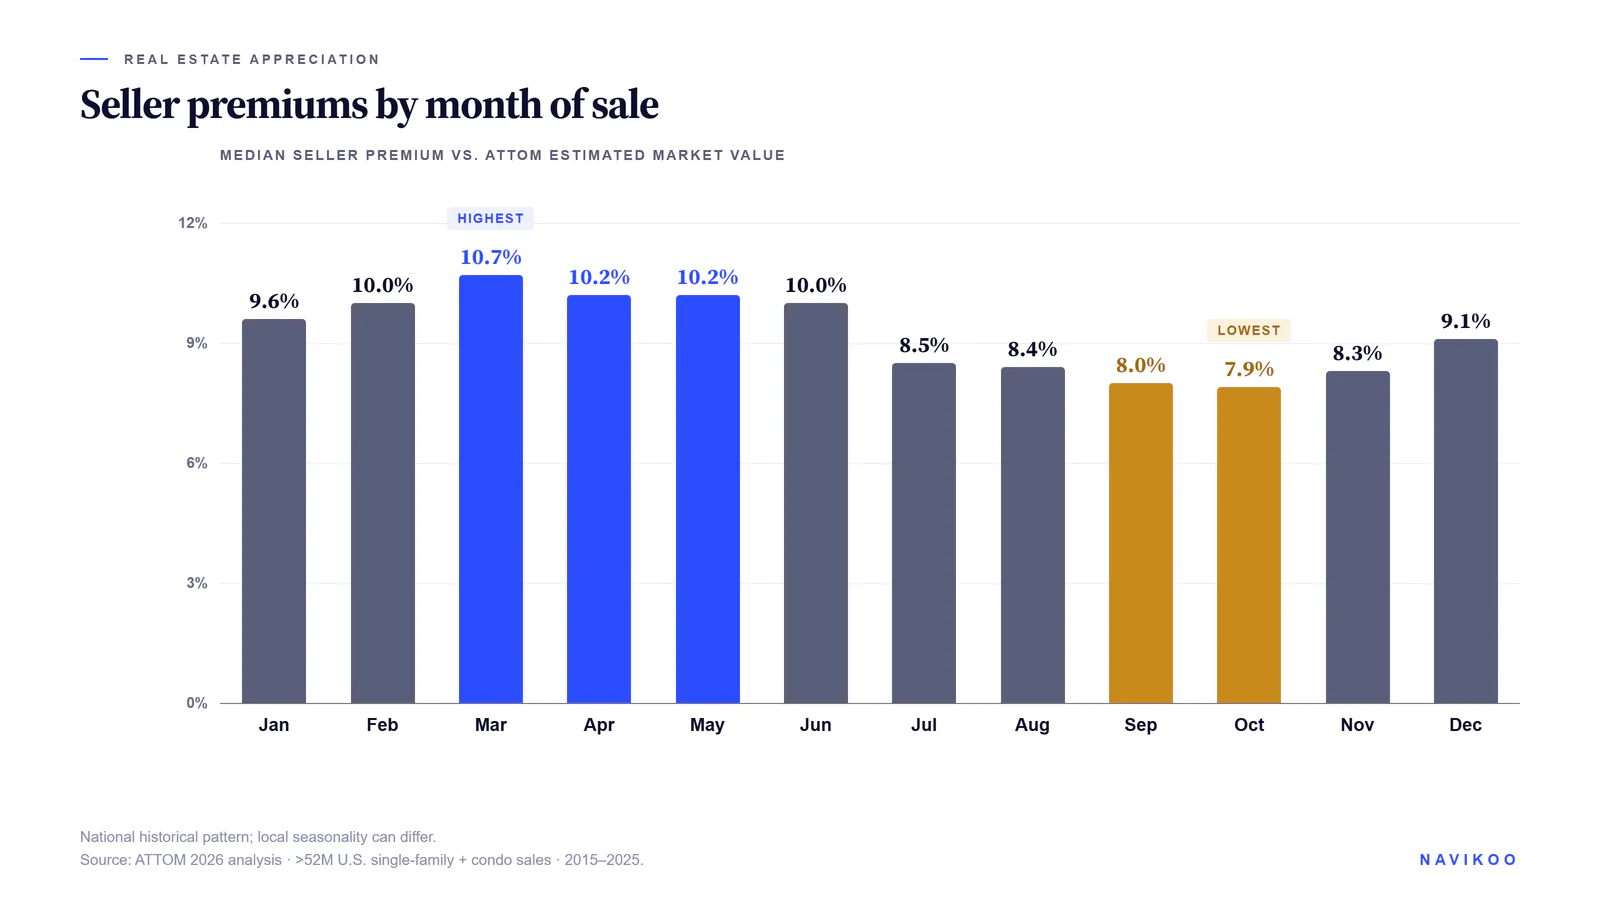
There is no universally hardest month because seasonality changes by market. In ATTOM's latest national analysis, covering more than 52 million single-family home and condo sales from 2015 through 2025, October had the lowest median seller premium over estimated market value at 7.9%, followed by September at 8.0%. March was highest at 10.7%.
That ATTOM measure is seller premium, not days on market or the chance of selling, so October is not automatically the hardest month in every city. Seasonal swings are also different from long-term growth, but they can change what an owner actually realizes at the exit.
Risks of Relying on Appreciation
Downturns Happen
Home values can fall, nationally or locally, and owners forced to sell during a decline lock in the loss. The 2026 FHFA data, with declines in four states, is a reminder that growth is not uniform even in a rising national market.
Gains Are Unrealized Until Sale
Real estate equity on paper cannot pay bills. Accessing it requires selling or borrowing, both of which carry costs.
Taxes and Selling Costs
Broker compensation, closing costs, and taxes all reduce realized real estate gains. Under current IRS rules, qualifying homeowners may exclude up to $250,000 of gain on a main home, or up to $500,000 on many joint returns, if the ownership and use tests are met. An investment property does not receive that main-home exclusion simply because it appreciated.
Tips for Holding a Property Through Market Cycles
Buy for income, treat growth as upside, and compare local price trends with inflation each year. Track home values and inventory in the specific neighborhood, not just national data. Keep the monthly loan cost and reserves sustainable so a downturn never forces a sale. And revisit fair market value at least once a year, because decisions about selling, refinancing, or adding another investment property depend on it.
The Role of Appreciation in a Real Estate Plan
Appreciation is one of four common ways real estate investments can build wealth, alongside cash flow, principal paydown, and tax benefits. Over a long hold it can become a large part of the result because value over time compounds, and it is the least certain of the four before buying.
That makes expected growth the input to handle most conservatively. The ten-year example above produced sale proceeds equal to 1.26x or 3.49x the original down payment, depending on market growth, before other ownership cash flows and costs. A real estate plan built to work with flat values, with future growth treated as a bonus, is more durable than one that needs the high case.